South American Indian vs Chilean Median Family Income
COMPARE
South American Indian
Chilean
Median Family Income
Median Family Income Comparison
South American Indians
Chileans
$103,624
MEDIAN FAMILY INCOME
61.9/ 100
METRIC RATING
167th/ 347
METRIC RANK
$108,429
MEDIAN FAMILY INCOME
95.0/ 100
METRIC RATING
116th/ 347
METRIC RANK
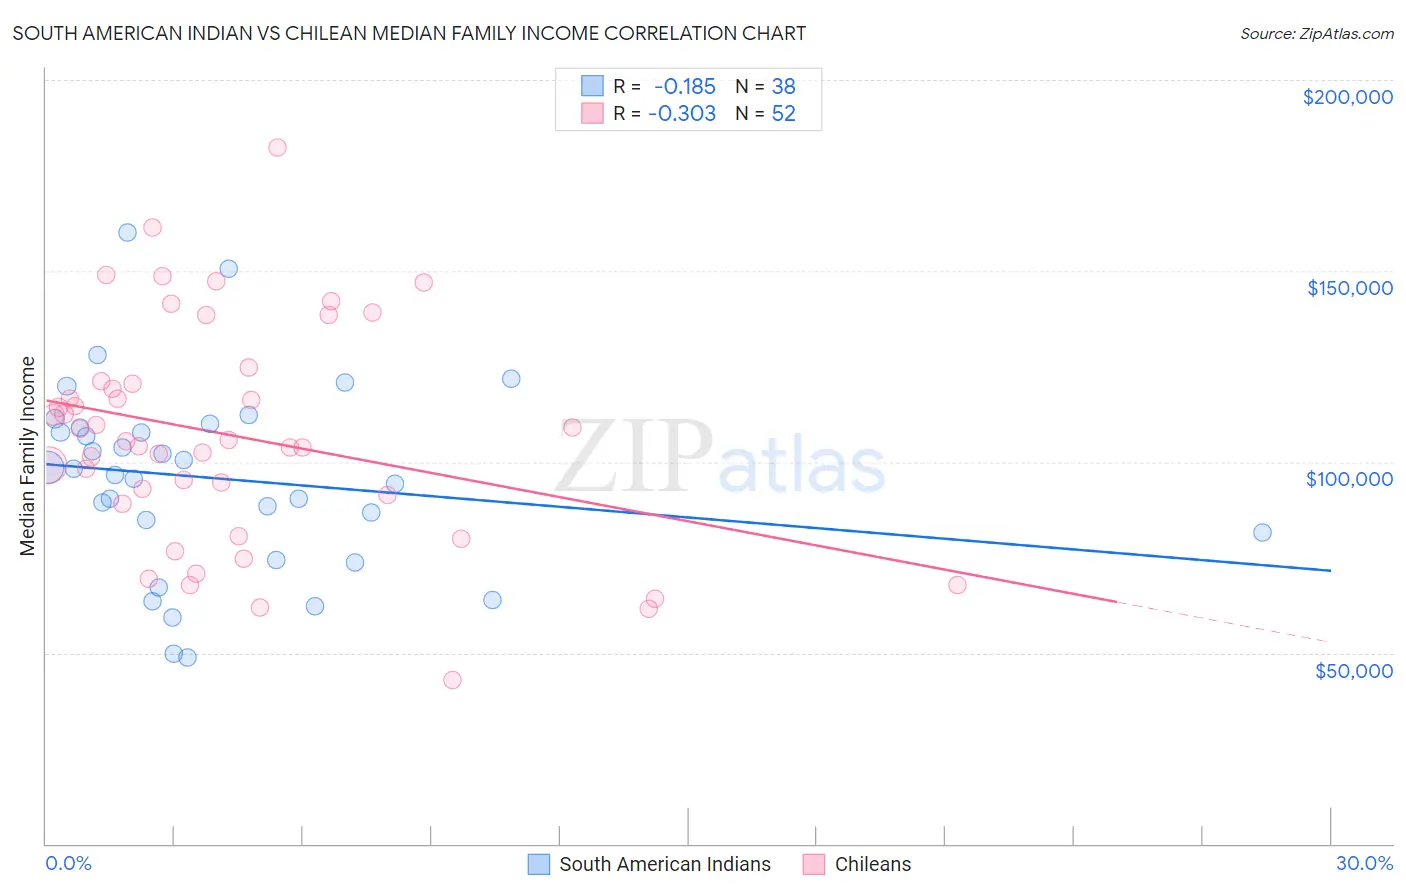
South American Indian vs Chilean Median Family Income Correlation Chart
The statistical analysis conducted on geographies consisting of 164,518,515 people shows a poor negative correlation between the proportion of South American Indians and median family income in the United States with a correlation coefficient (R) of -0.185 and weighted average of $103,624. Similarly, the statistical analysis conducted on geographies consisting of 256,482,123 people shows a mild negative correlation between the proportion of Chileans and median family income in the United States with a correlation coefficient (R) of -0.303 and weighted average of $108,429, a difference of 4.6%.
Median Family Income Correlation Summary
| Measurement | South American Indian | Chilean |
| Minimum | $48,893 | $42,833 |
| Maximum | $160,228 | $182,212 |
| Range | $111,335 | $139,379 |
| Mean | $95,594 | $106,873 |
| Median | $97,421 | $105,526 |
| Interquartile 25% (IQ1) | $81,563 | $90,247 |
| Interquartile 75% (IQ3) | $109,158 | $120,874 |
| Interquartile Range (IQR) | $27,595 | $30,627 |
| Standard Deviation (Sample) | $24,795 | $28,929 |
| Standard Deviation (Population) | $24,467 | $28,649 |
Similar Demographics by Median Family Income
Demographics Similar to South American Indians by Median Family Income
In terms of median family income, the demographic groups most similar to South American Indians are English ($103,684, a difference of 0.060%), Immigrants from Peru ($103,534, a difference of 0.090%), Slovak ($103,729, a difference of 0.10%), Sierra Leonean ($103,859, a difference of 0.23%), and Czechoslovakian ($103,273, a difference of 0.34%).
| Demographics | Rating | Rank | Median Family Income |
| Scottish | 69.5 /100 | #160 | Good $104,288 |
| Icelanders | 69.4 /100 | #161 | Good $104,282 |
| Immigrants | Sierra Leone | 66.2 /100 | #162 | Good $103,990 |
| Costa Ricans | 66.2 /100 | #163 | Good $103,989 |
| Sierra Leoneans | 64.7 /100 | #164 | Good $103,859 |
| Slovaks | 63.1 /100 | #165 | Good $103,729 |
| English | 62.6 /100 | #166 | Good $103,684 |
| South American Indians | 61.9 /100 | #167 | Good $103,624 |
| Immigrants | Peru | 60.8 /100 | #168 | Good $103,534 |
| Czechoslovakians | 57.6 /100 | #169 | Average $103,273 |
| Immigrants | Uzbekistan | 56.6 /100 | #170 | Average $103,197 |
| Alsatians | 54.3 /100 | #171 | Average $103,010 |
| Immigrants | Eritrea | 51.9 /100 | #172 | Average $102,823 |
| Belgians | 51.4 /100 | #173 | Average $102,788 |
| Finns | 50.0 /100 | #174 | Average $102,676 |
Demographics Similar to Chileans by Median Family Income
In terms of median family income, the demographic groups most similar to Chileans are Swedish ($108,499, a difference of 0.060%), Polish ($108,507, a difference of 0.070%), Immigrants from Saudi Arabia ($108,544, a difference of 0.11%), Immigrants from Poland ($108,570, a difference of 0.13%), and Immigrants from Philippines ($108,288, a difference of 0.13%).
| Demographics | Rating | Rank | Median Family Income |
| Immigrants | Afghanistan | 95.6 /100 | #109 | Exceptional $108,709 |
| British | 95.6 /100 | #110 | Exceptional $108,705 |
| Immigrants | Western Asia | 95.6 /100 | #111 | Exceptional $108,691 |
| Immigrants | Poland | 95.3 /100 | #112 | Exceptional $108,570 |
| Immigrants | Saudi Arabia | 95.2 /100 | #113 | Exceptional $108,544 |
| Poles | 95.2 /100 | #114 | Exceptional $108,507 |
| Swedes | 95.1 /100 | #115 | Exceptional $108,499 |
| Chileans | 95.0 /100 | #116 | Exceptional $108,429 |
| Immigrants | Philippines | 94.6 /100 | #117 | Exceptional $108,288 |
| Ethiopians | 94.5 /100 | #118 | Exceptional $108,251 |
| Sri Lankans | 94.5 /100 | #119 | Exceptional $108,234 |
| Immigrants | Northern Africa | 94.3 /100 | #120 | Exceptional $108,161 |
| Europeans | 94.1 /100 | #121 | Exceptional $108,099 |
| Immigrants | Jordan | 92.9 /100 | #122 | Exceptional $107,715 |
| Carpatho Rusyns | 92.2 /100 | #123 | Exceptional $107,502 |