Immigrants from Senegal vs Chilean Median Family Income
COMPARE
Immigrants from Senegal
Chilean
Median Family Income
Median Family Income Comparison
Immigrants from Senegal
Chileans
$92,912
MEDIAN FAMILY INCOME
0.7/ 100
METRIC RATING
247th/ 347
METRIC RANK
$108,429
MEDIAN FAMILY INCOME
95.0/ 100
METRIC RATING
116th/ 347
METRIC RANK
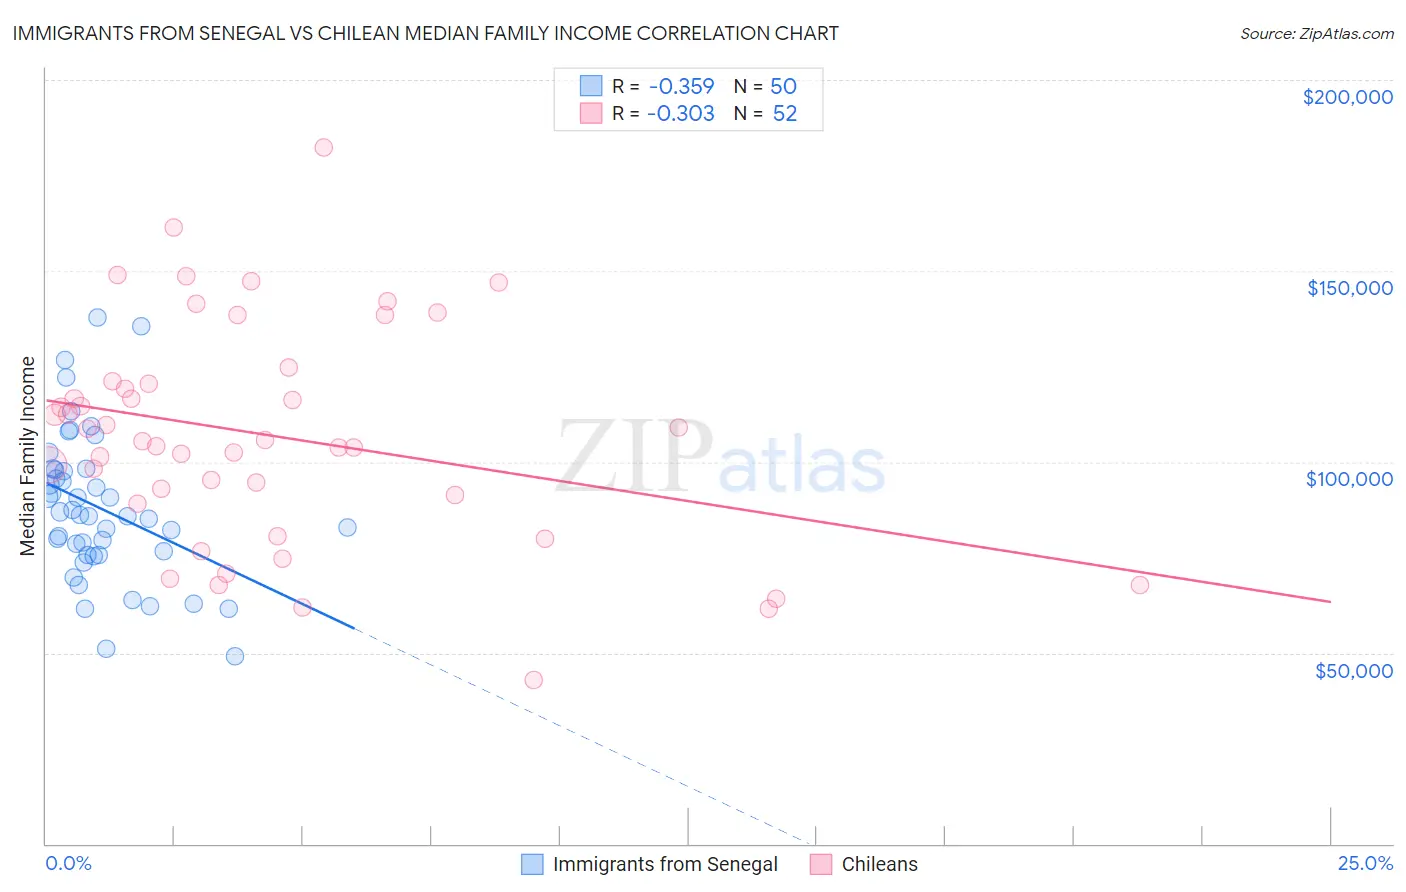
Immigrants from Senegal vs Chilean Median Family Income Correlation Chart
The statistical analysis conducted on geographies consisting of 90,105,018 people shows a mild negative correlation between the proportion of Immigrants from Senegal and median family income in the United States with a correlation coefficient (R) of -0.359 and weighted average of $92,912. Similarly, the statistical analysis conducted on geographies consisting of 256,482,123 people shows a mild negative correlation between the proportion of Chileans and median family income in the United States with a correlation coefficient (R) of -0.303 and weighted average of $108,429, a difference of 16.7%.
Median Family Income Correlation Summary
| Measurement | Immigrants from Senegal | Chilean |
| Minimum | $49,167 | $42,833 |
| Maximum | $137,892 | $182,212 |
| Range | $88,725 | $139,379 |
| Mean | $87,849 | $106,873 |
| Median | $85,966 | $105,526 |
| Interquartile 25% (IQ1) | $75,730 | $90,247 |
| Interquartile 75% (IQ3) | $97,800 | $120,874 |
| Interquartile Range (IQR) | $22,070 | $30,627 |
| Standard Deviation (Sample) | $19,522 | $28,929 |
| Standard Deviation (Population) | $19,326 | $28,649 |
Similar Demographics by Median Family Income
Demographics Similar to Immigrants from Senegal by Median Family Income
In terms of median family income, the demographic groups most similar to Immigrants from Senegal are French American Indian ($92,872, a difference of 0.040%), Immigrants from Ecuador ($92,837, a difference of 0.080%), West Indian ($92,765, a difference of 0.16%), Immigrants from Somalia ($92,609, a difference of 0.33%), and Immigrants from El Salvador ($92,545, a difference of 0.40%).
| Demographics | Rating | Rank | Median Family Income |
| Somalis | 1.2 /100 | #240 | Tragic $94,085 |
| Immigrants | Trinidad and Tobago | 1.2 /100 | #241 | Tragic $93,988 |
| Barbadians | 1.1 /100 | #242 | Tragic $93,919 |
| German Russians | 1.1 /100 | #243 | Tragic $93,858 |
| Sub-Saharan Africans | 1.0 /100 | #244 | Tragic $93,748 |
| Immigrants | Middle Africa | 1.0 /100 | #245 | Tragic $93,593 |
| Guyanese | 0.9 /100 | #246 | Tragic $93,373 |
| Immigrants | Senegal | 0.7 /100 | #247 | Tragic $92,912 |
| French American Indians | 0.7 /100 | #248 | Tragic $92,872 |
| Immigrants | Ecuador | 0.7 /100 | #249 | Tragic $92,837 |
| West Indians | 0.6 /100 | #250 | Tragic $92,765 |
| Immigrants | Somalia | 0.6 /100 | #251 | Tragic $92,609 |
| Immigrants | El Salvador | 0.6 /100 | #252 | Tragic $92,545 |
| Immigrants | Guyana | 0.6 /100 | #253 | Tragic $92,513 |
| Immigrants | Barbados | 0.5 /100 | #254 | Tragic $92,419 |
Demographics Similar to Chileans by Median Family Income
In terms of median family income, the demographic groups most similar to Chileans are Swedish ($108,499, a difference of 0.060%), Polish ($108,507, a difference of 0.070%), Immigrants from Saudi Arabia ($108,544, a difference of 0.11%), Immigrants from Poland ($108,570, a difference of 0.13%), and Immigrants from Philippines ($108,288, a difference of 0.13%).
| Demographics | Rating | Rank | Median Family Income |
| Immigrants | Afghanistan | 95.6 /100 | #109 | Exceptional $108,709 |
| British | 95.6 /100 | #110 | Exceptional $108,705 |
| Immigrants | Western Asia | 95.6 /100 | #111 | Exceptional $108,691 |
| Immigrants | Poland | 95.3 /100 | #112 | Exceptional $108,570 |
| Immigrants | Saudi Arabia | 95.2 /100 | #113 | Exceptional $108,544 |
| Poles | 95.2 /100 | #114 | Exceptional $108,507 |
| Swedes | 95.1 /100 | #115 | Exceptional $108,499 |
| Chileans | 95.0 /100 | #116 | Exceptional $108,429 |
| Immigrants | Philippines | 94.6 /100 | #117 | Exceptional $108,288 |
| Ethiopians | 94.5 /100 | #118 | Exceptional $108,251 |
| Sri Lankans | 94.5 /100 | #119 | Exceptional $108,234 |
| Immigrants | Northern Africa | 94.3 /100 | #120 | Exceptional $108,161 |
| Europeans | 94.1 /100 | #121 | Exceptional $108,099 |
| Immigrants | Jordan | 92.9 /100 | #122 | Exceptional $107,715 |
| Carpatho Rusyns | 92.2 /100 | #123 | Exceptional $107,502 |