South American Indian vs Tlingit-Haida Median Family Income
COMPARE
South American Indian
Tlingit-Haida
Median Family Income
Median Family Income Comparison
South American Indians
Tlingit-Haida
$103,624
MEDIAN FAMILY INCOME
61.9/ 100
METRIC RATING
167th/ 347
METRIC RANK
$101,092
MEDIAN FAMILY INCOME
30.8/ 100
METRIC RATING
187th/ 347
METRIC RANK
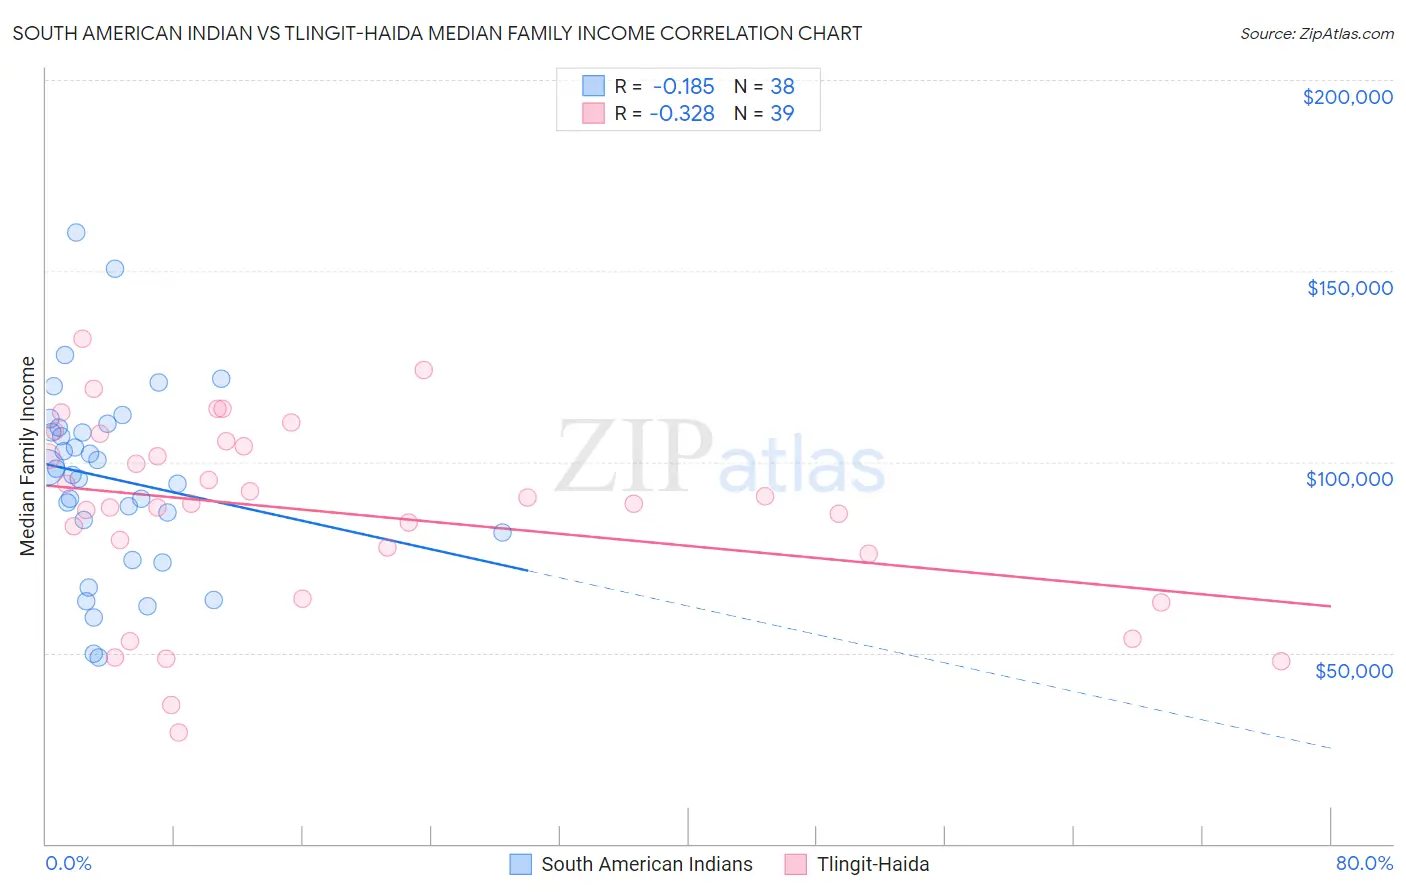
South American Indian vs Tlingit-Haida Median Family Income Correlation Chart
The statistical analysis conducted on geographies consisting of 164,518,515 people shows a poor negative correlation between the proportion of South American Indians and median family income in the United States with a correlation coefficient (R) of -0.185 and weighted average of $103,624. Similarly, the statistical analysis conducted on geographies consisting of 60,853,273 people shows a mild negative correlation between the proportion of Tlingit-Haida and median family income in the United States with a correlation coefficient (R) of -0.328 and weighted average of $101,092, a difference of 2.5%.
Median Family Income Correlation Summary
| Measurement | South American Indian | Tlingit-Haida |
| Minimum | $48,893 | $29,250 |
| Maximum | $160,228 | $132,184 |
| Range | $111,335 | $102,934 |
| Mean | $95,594 | $86,951 |
| Median | $97,421 | $88,958 |
| Interquartile 25% (IQ1) | $81,563 | $75,972 |
| Interquartile 75% (IQ3) | $109,158 | $105,493 |
| Interquartile Range (IQR) | $27,595 | $29,521 |
| Standard Deviation (Sample) | $24,795 | $24,804 |
| Standard Deviation (Population) | $24,467 | $24,484 |
Demographics Similar to South American Indians and Tlingit-Haida by Median Family Income
In terms of median family income, the demographic groups most similar to South American Indians are Immigrants from Peru ($103,534, a difference of 0.090%), Czechoslovakian ($103,273, a difference of 0.34%), Immigrants from Uzbekistan ($103,197, a difference of 0.41%), Alsatian ($103,010, a difference of 0.60%), and Immigrants from Eritrea ($102,823, a difference of 0.78%). Similarly, the demographic groups most similar to Tlingit-Haida are Celtic ($101,139, a difference of 0.050%), Dutch ($101,192, a difference of 0.10%), Immigrants from Costa Rica ($101,354, a difference of 0.26%), Kenyan ($101,417, a difference of 0.32%), and Tsimshian ($101,543, a difference of 0.45%).
| Demographics | Rating | Rank | Median Family Income |
| South American Indians | 61.9 /100 | #167 | Good $103,624 |
| Immigrants | Peru | 60.8 /100 | #168 | Good $103,534 |
| Czechoslovakians | 57.6 /100 | #169 | Average $103,273 |
| Immigrants | Uzbekistan | 56.6 /100 | #170 | Average $103,197 |
| Alsatians | 54.3 /100 | #171 | Average $103,010 |
| Immigrants | Eritrea | 51.9 /100 | #172 | Average $102,823 |
| Belgians | 51.4 /100 | #173 | Average $102,788 |
| Finns | 50.0 /100 | #174 | Average $102,676 |
| Immigrants | Eastern Africa | 47.1 /100 | #175 | Average $102,451 |
| French | 46.1 /100 | #176 | Average $102,368 |
| Germans | 44.6 /100 | #177 | Average $102,254 |
| Welsh | 43.3 /100 | #178 | Average $102,151 |
| South Americans | 39.7 /100 | #179 | Fair $101,856 |
| French Canadians | 37.0 /100 | #180 | Fair $101,634 |
| Spaniards | 36.8 /100 | #181 | Fair $101,617 |
| Tsimshian | 35.9 /100 | #182 | Fair $101,543 |
| Kenyans | 34.5 /100 | #183 | Fair $101,417 |
| Immigrants | Costa Rica | 33.7 /100 | #184 | Fair $101,354 |
| Dutch | 31.9 /100 | #185 | Fair $101,192 |
| Celtics | 31.3 /100 | #186 | Fair $101,139 |
| Tlingit-Haida | 30.8 /100 | #187 | Fair $101,092 |