South American Indian vs Subsaharan African Median Family Income
COMPARE
South American Indian
Subsaharan African
Median Family Income
Median Family Income Comparison
South American Indians
Sub-Saharan Africans
$103,624
MEDIAN FAMILY INCOME
61.9/ 100
METRIC RATING
167th/ 347
METRIC RANK
$93,748
MEDIAN FAMILY INCOME
1.0/ 100
METRIC RATING
244th/ 347
METRIC RANK
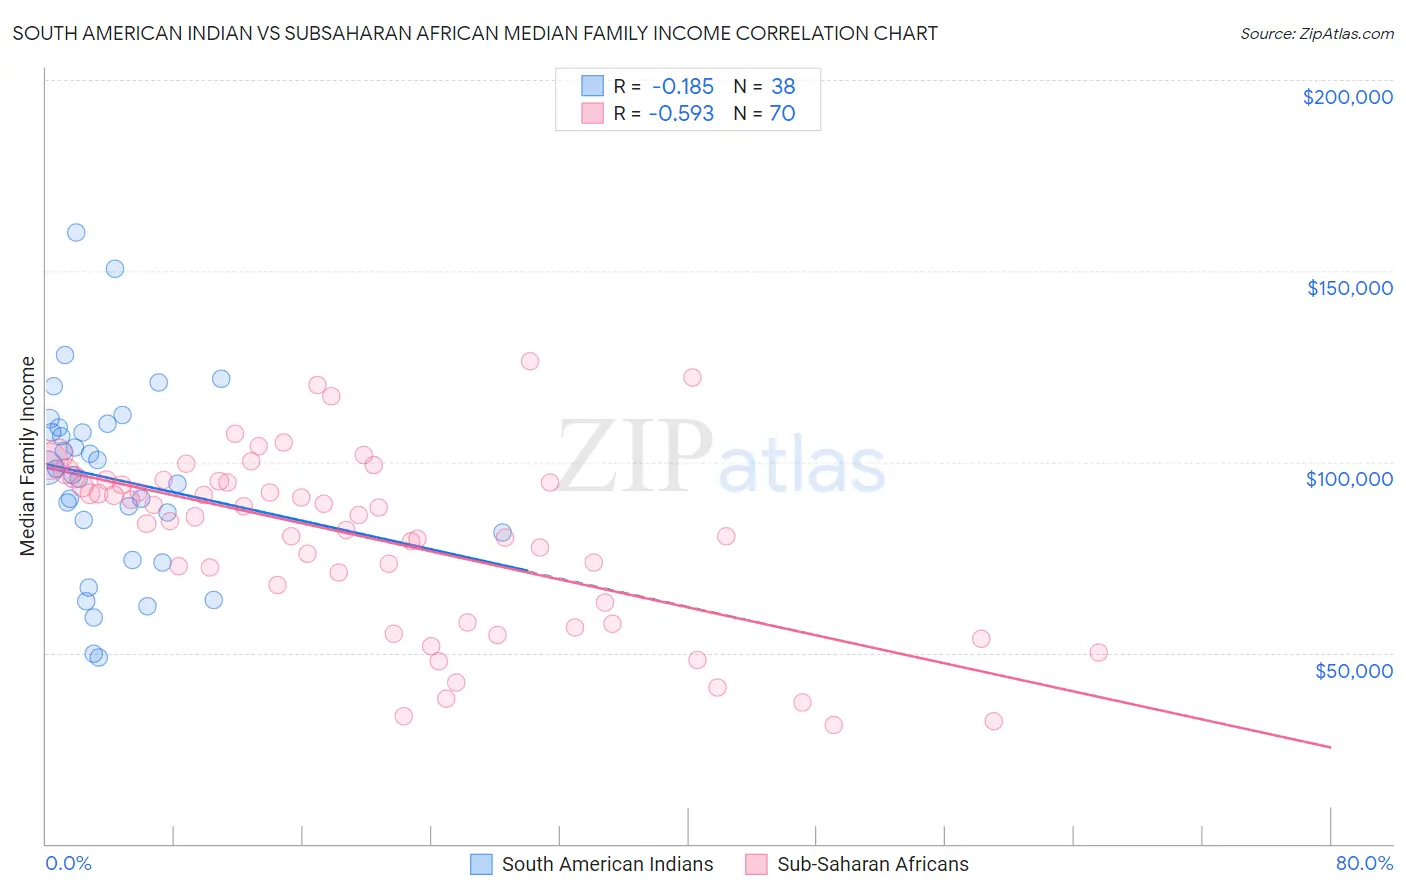
South American Indian vs Subsaharan African Median Family Income Correlation Chart
The statistical analysis conducted on geographies consisting of 164,518,515 people shows a poor negative correlation between the proportion of South American Indians and median family income in the United States with a correlation coefficient (R) of -0.185 and weighted average of $103,624. Similarly, the statistical analysis conducted on geographies consisting of 507,233,451 people shows a substantial negative correlation between the proportion of Sub-Saharan Africans and median family income in the United States with a correlation coefficient (R) of -0.593 and weighted average of $93,748, a difference of 10.5%.
Median Family Income Correlation Summary
| Measurement | South American Indian | Subsaharan African |
| Minimum | $48,893 | $31,084 |
| Maximum | $160,228 | $126,507 |
| Range | $111,335 | $95,423 |
| Mean | $95,594 | $80,060 |
| Median | $97,421 | $85,890 |
| Interquartile 25% (IQ1) | $81,563 | $63,281 |
| Interquartile 75% (IQ3) | $109,158 | $94,886 |
| Interquartile Range (IQR) | $27,595 | $31,605 |
| Standard Deviation (Sample) | $24,795 | $22,942 |
| Standard Deviation (Population) | $24,467 | $22,778 |
Similar Demographics by Median Family Income
Demographics Similar to South American Indians by Median Family Income
In terms of median family income, the demographic groups most similar to South American Indians are English ($103,684, a difference of 0.060%), Immigrants from Peru ($103,534, a difference of 0.090%), Slovak ($103,729, a difference of 0.10%), Sierra Leonean ($103,859, a difference of 0.23%), and Czechoslovakian ($103,273, a difference of 0.34%).
| Demographics | Rating | Rank | Median Family Income |
| Scottish | 69.5 /100 | #160 | Good $104,288 |
| Icelanders | 69.4 /100 | #161 | Good $104,282 |
| Immigrants | Sierra Leone | 66.2 /100 | #162 | Good $103,990 |
| Costa Ricans | 66.2 /100 | #163 | Good $103,989 |
| Sierra Leoneans | 64.7 /100 | #164 | Good $103,859 |
| Slovaks | 63.1 /100 | #165 | Good $103,729 |
| English | 62.6 /100 | #166 | Good $103,684 |
| South American Indians | 61.9 /100 | #167 | Good $103,624 |
| Immigrants | Peru | 60.8 /100 | #168 | Good $103,534 |
| Czechoslovakians | 57.6 /100 | #169 | Average $103,273 |
| Immigrants | Uzbekistan | 56.6 /100 | #170 | Average $103,197 |
| Alsatians | 54.3 /100 | #171 | Average $103,010 |
| Immigrants | Eritrea | 51.9 /100 | #172 | Average $102,823 |
| Belgians | 51.4 /100 | #173 | Average $102,788 |
| Finns | 50.0 /100 | #174 | Average $102,676 |
Demographics Similar to Sub-Saharan Africans by Median Family Income
In terms of median family income, the demographic groups most similar to Sub-Saharan Africans are German Russian ($93,858, a difference of 0.12%), Immigrants from Middle Africa ($93,593, a difference of 0.17%), Barbadian ($93,919, a difference of 0.18%), Immigrants from Trinidad and Tobago ($93,988, a difference of 0.26%), and Somali ($94,085, a difference of 0.36%).
| Demographics | Rating | Rank | Median Family Income |
| Alaskan Athabascans | 1.5 /100 | #237 | Tragic $94,429 |
| Nepalese | 1.3 /100 | #238 | Tragic $94,153 |
| Salvadorans | 1.2 /100 | #239 | Tragic $94,109 |
| Somalis | 1.2 /100 | #240 | Tragic $94,085 |
| Immigrants | Trinidad and Tobago | 1.2 /100 | #241 | Tragic $93,988 |
| Barbadians | 1.1 /100 | #242 | Tragic $93,919 |
| German Russians | 1.1 /100 | #243 | Tragic $93,858 |
| Sub-Saharan Africans | 1.0 /100 | #244 | Tragic $93,748 |
| Immigrants | Middle Africa | 1.0 /100 | #245 | Tragic $93,593 |
| Guyanese | 0.9 /100 | #246 | Tragic $93,373 |
| Immigrants | Senegal | 0.7 /100 | #247 | Tragic $92,912 |
| French American Indians | 0.7 /100 | #248 | Tragic $92,872 |
| Immigrants | Ecuador | 0.7 /100 | #249 | Tragic $92,837 |
| West Indians | 0.6 /100 | #250 | Tragic $92,765 |
| Immigrants | Somalia | 0.6 /100 | #251 | Tragic $92,609 |