Aleut vs Chilean Median Family Income
COMPARE
Aleut
Chilean
Median Family Income
Median Family Income Comparison
Aleuts
Chileans
$98,702
MEDIAN FAMILY INCOME
11.6/ 100
METRIC RATING
207th/ 347
METRIC RANK
$108,429
MEDIAN FAMILY INCOME
95.0/ 100
METRIC RATING
116th/ 347
METRIC RANK
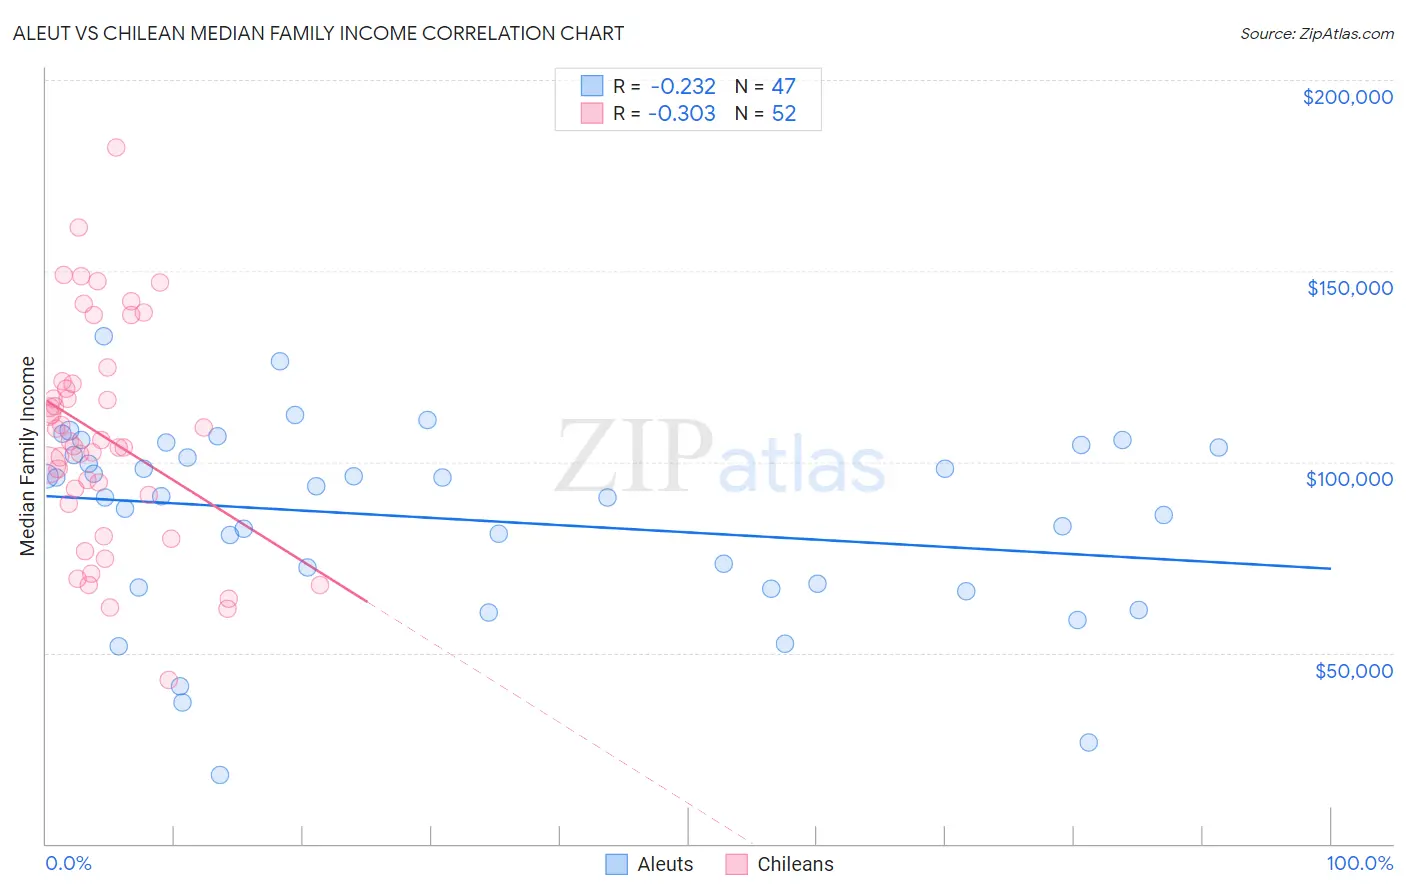
Aleut vs Chilean Median Family Income Correlation Chart
The statistical analysis conducted on geographies consisting of 61,771,380 people shows a weak negative correlation between the proportion of Aleuts and median family income in the United States with a correlation coefficient (R) of -0.232 and weighted average of $98,702. Similarly, the statistical analysis conducted on geographies consisting of 256,482,123 people shows a mild negative correlation between the proportion of Chileans and median family income in the United States with a correlation coefficient (R) of -0.303 and weighted average of $108,429, a difference of 9.9%.
Median Family Income Correlation Summary
| Measurement | Aleut | Chilean |
| Minimum | $18,125 | $42,833 |
| Maximum | $132,750 | $182,212 |
| Range | $114,625 | $139,379 |
| Mean | $85,071 | $106,873 |
| Median | $90,875 | $105,526 |
| Interquartile 25% (IQ1) | $67,198 | $90,247 |
| Interquartile 75% (IQ3) | $103,750 | $120,874 |
| Interquartile Range (IQR) | $36,552 | $30,627 |
| Standard Deviation (Sample) | $24,932 | $28,929 |
| Standard Deviation (Population) | $24,665 | $28,649 |
Similar Demographics by Median Family Income
Demographics Similar to Aleuts by Median Family Income
In terms of median family income, the demographic groups most similar to Aleuts are Immigrants from Iraq ($98,786, a difference of 0.080%), Hawaiian ($98,869, a difference of 0.17%), Ghanaian ($98,877, a difference of 0.18%), Immigrants from Uruguay ($98,205, a difference of 0.51%), and Immigrants from Colombia ($98,067, a difference of 0.65%).
| Demographics | Rating | Rank | Median Family Income |
| Spanish | 20.1 /100 | #200 | Fair $99,977 |
| Immigrants | Thailand | 19.0 /100 | #201 | Poor $99,840 |
| Whites/Caucasians | 18.7 /100 | #202 | Poor $99,800 |
| Scotch-Irish | 17.1 /100 | #203 | Poor $99,591 |
| Ghanaians | 12.6 /100 | #204 | Poor $98,877 |
| Hawaiians | 12.5 /100 | #205 | Poor $98,869 |
| Immigrants | Iraq | 12.1 /100 | #206 | Poor $98,786 |
| Aleuts | 11.6 /100 | #207 | Poor $98,702 |
| Immigrants | Uruguay | 9.2 /100 | #208 | Tragic $98,205 |
| Immigrants | Colombia | 8.7 /100 | #209 | Tragic $98,067 |
| Puget Sound Salish | 8.2 /100 | #210 | Tragic $97,958 |
| Immigrants | Sudan | 7.4 /100 | #211 | Tragic $97,737 |
| Panamanians | 7.2 /100 | #212 | Tragic $97,683 |
| Immigrants | Armenia | 7.0 /100 | #213 | Tragic $97,605 |
| Bermudans | 6.9 /100 | #214 | Tragic $97,577 |
Demographics Similar to Chileans by Median Family Income
In terms of median family income, the demographic groups most similar to Chileans are Swedish ($108,499, a difference of 0.060%), Polish ($108,507, a difference of 0.070%), Immigrants from Saudi Arabia ($108,544, a difference of 0.11%), Immigrants from Poland ($108,570, a difference of 0.13%), and Immigrants from Philippines ($108,288, a difference of 0.13%).
| Demographics | Rating | Rank | Median Family Income |
| Immigrants | Afghanistan | 95.6 /100 | #109 | Exceptional $108,709 |
| British | 95.6 /100 | #110 | Exceptional $108,705 |
| Immigrants | Western Asia | 95.6 /100 | #111 | Exceptional $108,691 |
| Immigrants | Poland | 95.3 /100 | #112 | Exceptional $108,570 |
| Immigrants | Saudi Arabia | 95.2 /100 | #113 | Exceptional $108,544 |
| Poles | 95.2 /100 | #114 | Exceptional $108,507 |
| Swedes | 95.1 /100 | #115 | Exceptional $108,499 |
| Chileans | 95.0 /100 | #116 | Exceptional $108,429 |
| Immigrants | Philippines | 94.6 /100 | #117 | Exceptional $108,288 |
| Ethiopians | 94.5 /100 | #118 | Exceptional $108,251 |
| Sri Lankans | 94.5 /100 | #119 | Exceptional $108,234 |
| Immigrants | Northern Africa | 94.3 /100 | #120 | Exceptional $108,161 |
| Europeans | 94.1 /100 | #121 | Exceptional $108,099 |
| Immigrants | Jordan | 92.9 /100 | #122 | Exceptional $107,715 |
| Carpatho Rusyns | 92.2 /100 | #123 | Exceptional $107,502 |