Syrian vs Chilean Median Family Income
COMPARE
Syrian
Chilean
Median Family Income
Median Family Income Comparison
Syrians
Chileans
$109,299
MEDIAN FAMILY INCOME
96.7/ 100
METRIC RATING
105th/ 347
METRIC RANK
$108,429
MEDIAN FAMILY INCOME
95.0/ 100
METRIC RATING
116th/ 347
METRIC RANK
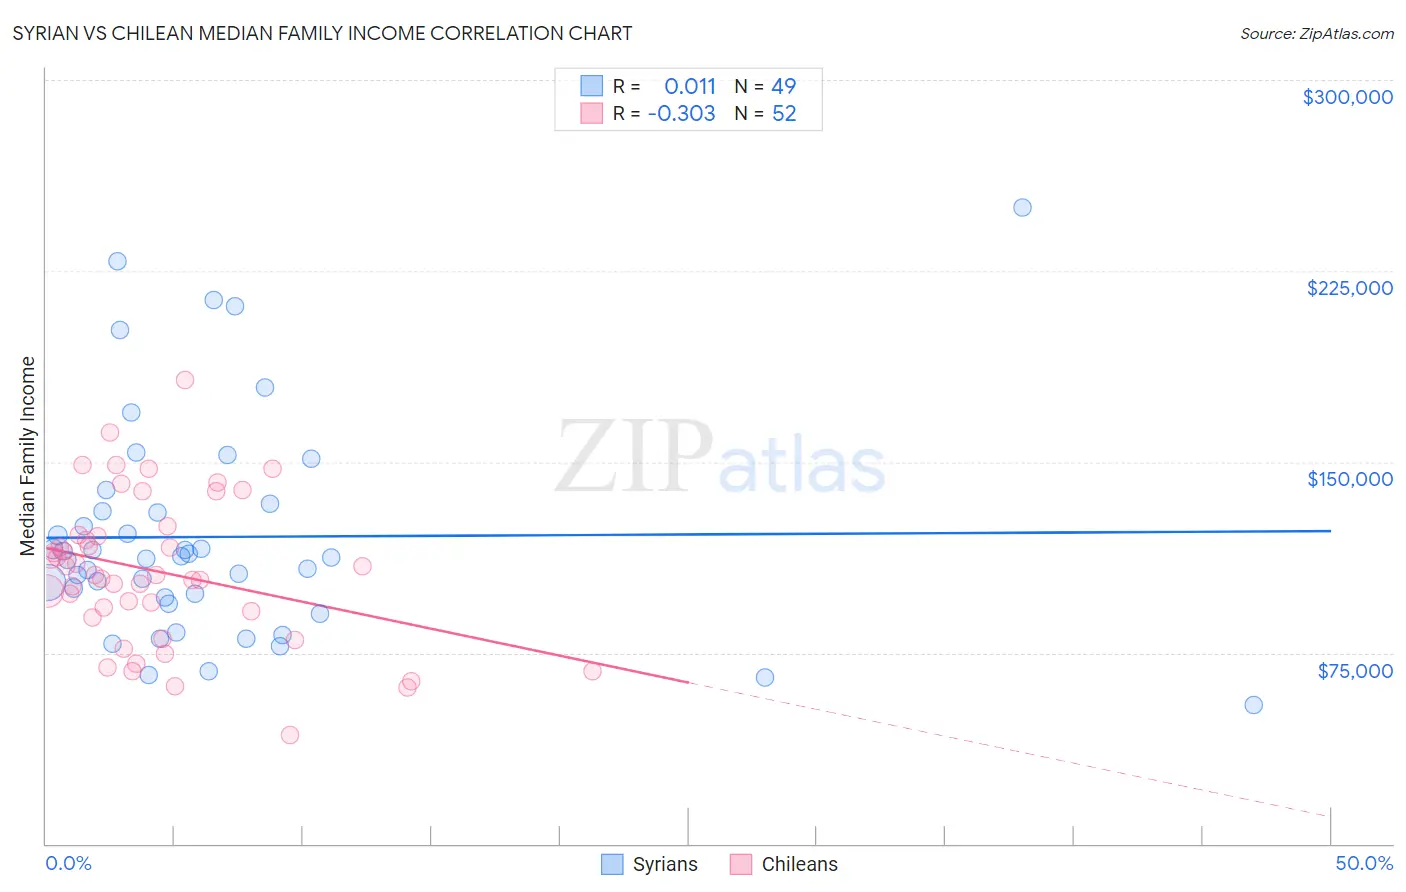
Syrian vs Chilean Median Family Income Correlation Chart
The statistical analysis conducted on geographies consisting of 266,121,258 people shows no correlation between the proportion of Syrians and median family income in the United States with a correlation coefficient (R) of 0.011 and weighted average of $109,299. Similarly, the statistical analysis conducted on geographies consisting of 256,482,123 people shows a mild negative correlation between the proportion of Chileans and median family income in the United States with a correlation coefficient (R) of -0.303 and weighted average of $108,429, a difference of 0.80%.
Median Family Income Correlation Summary
| Measurement | Syrian | Chilean |
| Minimum | $54,375 | $42,833 |
| Maximum | $250,001 | $182,212 |
| Range | $195,626 | $139,379 |
| Mean | $120,507 | $106,873 |
| Median | $112,639 | $105,526 |
| Interquartile 25% (IQ1) | $95,409 | $90,247 |
| Interquartile 75% (IQ3) | $132,003 | $120,874 |
| Interquartile Range (IQR) | $36,594 | $30,627 |
| Standard Deviation (Sample) | $43,231 | $28,929 |
| Standard Deviation (Population) | $42,788 | $28,649 |
Demographics Similar to Syrians and Chileans by Median Family Income
In terms of median family income, the demographic groups most similar to Syrians are Palestinian ($109,413, a difference of 0.10%), Immigrants from Brazil ($109,418, a difference of 0.11%), Albanian ($109,136, a difference of 0.15%), Immigrants from North Macedonia ($109,136, a difference of 0.15%), and Assyrian/Chaldean/Syriac ($109,622, a difference of 0.30%). Similarly, the demographic groups most similar to Chileans are Swedish ($108,499, a difference of 0.060%), Polish ($108,507, a difference of 0.070%), Immigrants from Saudi Arabia ($108,544, a difference of 0.11%), Immigrants from Poland ($108,570, a difference of 0.13%), and Immigrants from Philippines ($108,288, a difference of 0.13%).
| Demographics | Rating | Rank | Median Family Income |
| Macedonians | 97.3 /100 | #100 | Exceptional $109,668 |
| Immigrants | Ukraine | 97.2 /100 | #101 | Exceptional $109,645 |
| Assyrians/Chaldeans/Syriacs | 97.2 /100 | #102 | Exceptional $109,622 |
| Immigrants | Brazil | 96.9 /100 | #103 | Exceptional $109,418 |
| Palestinians | 96.9 /100 | #104 | Exceptional $109,413 |
| Syrians | 96.7 /100 | #105 | Exceptional $109,299 |
| Albanians | 96.4 /100 | #106 | Exceptional $109,136 |
| Immigrants | North Macedonia | 96.4 /100 | #107 | Exceptional $109,136 |
| Immigrants | Zimbabwe | 95.9 /100 | #108 | Exceptional $108,830 |
| Immigrants | Afghanistan | 95.6 /100 | #109 | Exceptional $108,709 |
| British | 95.6 /100 | #110 | Exceptional $108,705 |
| Immigrants | Western Asia | 95.6 /100 | #111 | Exceptional $108,691 |
| Immigrants | Poland | 95.3 /100 | #112 | Exceptional $108,570 |
| Immigrants | Saudi Arabia | 95.2 /100 | #113 | Exceptional $108,544 |
| Poles | 95.2 /100 | #114 | Exceptional $108,507 |
| Swedes | 95.1 /100 | #115 | Exceptional $108,499 |
| Chileans | 95.0 /100 | #116 | Exceptional $108,429 |
| Immigrants | Philippines | 94.6 /100 | #117 | Exceptional $108,288 |
| Ethiopians | 94.5 /100 | #118 | Exceptional $108,251 |
| Sri Lankans | 94.5 /100 | #119 | Exceptional $108,234 |
| Immigrants | Northern Africa | 94.3 /100 | #120 | Exceptional $108,161 |