South American Indian vs Chilean Householder Income Ages 25 - 44 years
COMPARE
South American Indian
Chilean
Householder Income Ages 25 - 44 years
Householder Income Ages 25 - 44 years Comparison
South American Indians
Chileans
$96,497
HOUSEHOLDER INCOME AGES 25 - 44 YEARS
74.5/ 100
METRIC RATING
152nd/ 347
METRIC RANK
$99,900
HOUSEHOLDER INCOME AGES 25 - 44 YEARS
95.1/ 100
METRIC RATING
111th/ 347
METRIC RANK
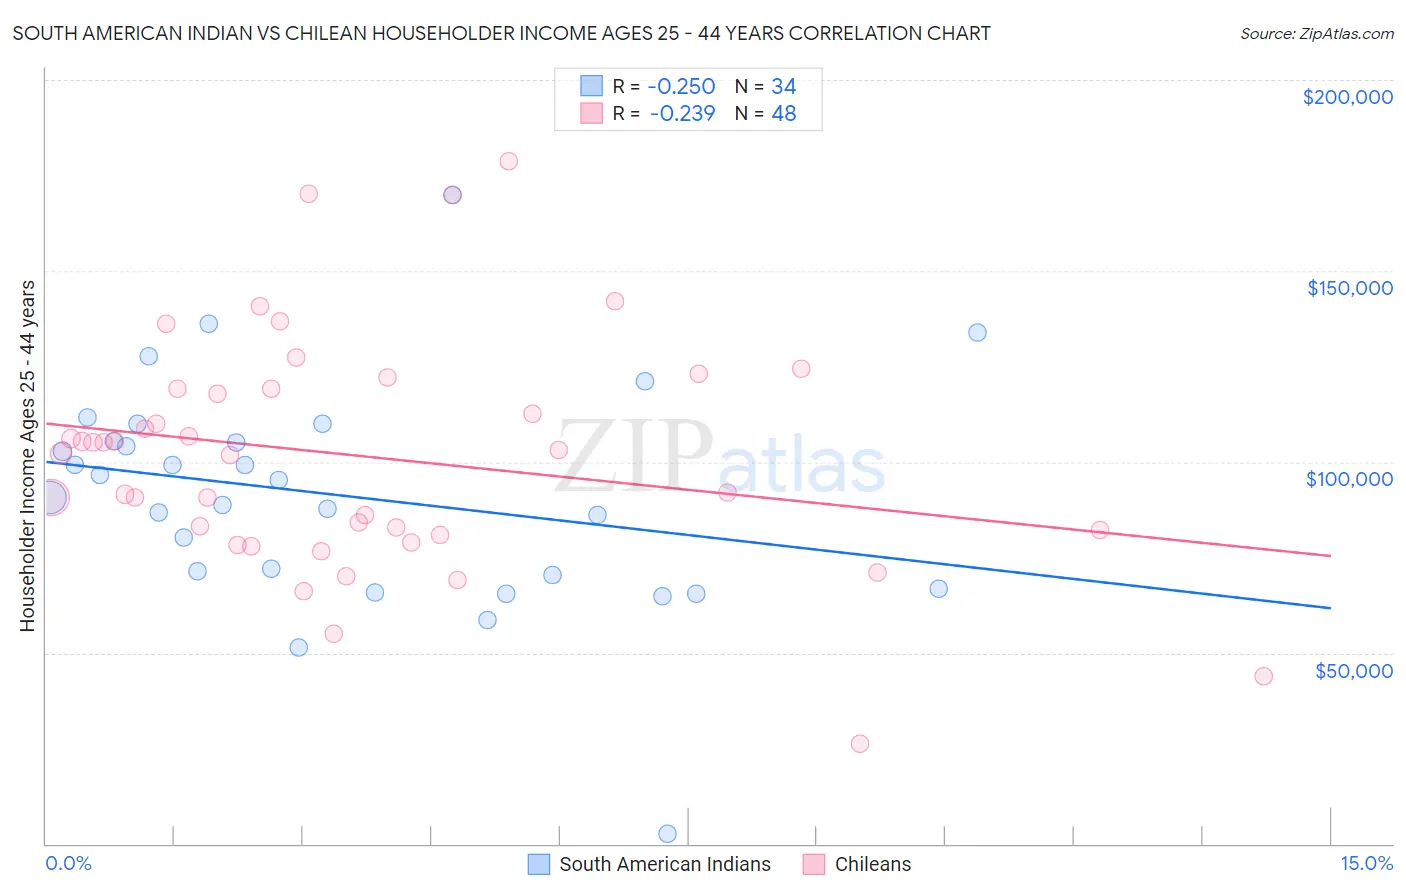
South American Indian vs Chilean Householder Income Ages 25 - 44 years Correlation Chart
The statistical analysis conducted on geographies consisting of 164,455,741 people shows a weak negative correlation between the proportion of South American Indians and household income with householder between the ages 25 and 44 in the United States with a correlation coefficient (R) of -0.250 and weighted average of $96,497. Similarly, the statistical analysis conducted on geographies consisting of 256,390,740 people shows a weak negative correlation between the proportion of Chileans and household income with householder between the ages 25 and 44 in the United States with a correlation coefficient (R) of -0.239 and weighted average of $99,900, a difference of 3.5%.
Householder Income Ages 25 - 44 years Correlation Summary
| Measurement | South American Indian | Chilean |
| Minimum | $2,499 | $26,028 |
| Maximum | $170,036 | $178,828 |
| Range | $167,537 | $152,800 |
| Mean | $91,221 | $101,398 |
| Median | $92,899 | $102,616 |
| Interquartile 25% (IQ1) | $70,385 | $81,519 |
| Interquartile 75% (IQ3) | $105,466 | $119,228 |
| Interquartile Range (IQR) | $35,081 | $37,709 |
| Standard Deviation (Sample) | $29,879 | $30,801 |
| Standard Deviation (Population) | $29,437 | $30,478 |
Similar Demographics by Householder Income Ages 25 - 44 years
Demographics Similar to South American Indians by Householder Income Ages 25 - 44 years
In terms of householder income ages 25 - 44 years, the demographic groups most similar to South American Indians are Czech ($96,525, a difference of 0.030%), Slovene ($96,439, a difference of 0.060%), Slavic ($96,377, a difference of 0.12%), Ugandan ($96,667, a difference of 0.18%), and Basque ($96,709, a difference of 0.22%).
| Demographics | Rating | Rank | Householder Income Ages 25 - 44 years |
| Norwegians | 78.2 /100 | #145 | Good $96,866 |
| Ethiopians | 77.8 /100 | #146 | Good $96,824 |
| Immigrants | Syria | 77.4 /100 | #147 | Good $96,789 |
| Irish | 76.9 /100 | #148 | Good $96,730 |
| Basques | 76.6 /100 | #149 | Good $96,709 |
| Ugandans | 76.2 /100 | #150 | Good $96,667 |
| Czechs | 74.8 /100 | #151 | Good $96,525 |
| South American Indians | 74.5 /100 | #152 | Good $96,497 |
| Slovenes | 73.9 /100 | #153 | Good $96,439 |
| Slavs | 73.2 /100 | #154 | Good $96,377 |
| Moroccans | 70.3 /100 | #155 | Good $96,117 |
| Immigrants | Germany | 67.9 /100 | #156 | Good $95,913 |
| Immigrants | Uganda | 65.2 /100 | #157 | Good $95,698 |
| Scandinavians | 63.9 /100 | #158 | Good $95,596 |
| Costa Ricans | 63.5 /100 | #159 | Good $95,565 |
Demographics Similar to Chileans by Householder Income Ages 25 - 44 years
In terms of householder income ages 25 - 44 years, the demographic groups most similar to Chileans are Immigrants from Afghanistan ($99,977, a difference of 0.080%), Immigrants from North Macedonia ($100,101, a difference of 0.20%), Polish ($99,685, a difference of 0.22%), Tongan ($99,604, a difference of 0.30%), and Immigrants from South Eastern Asia ($100,283, a difference of 0.38%).
| Demographics | Rating | Rank | Householder Income Ages 25 - 44 years |
| Immigrants | Poland | 97.4 /100 | #104 | Exceptional $101,065 |
| Immigrants | Vietnam | 96.5 /100 | #105 | Exceptional $100,535 |
| Immigrants | Brazil | 96.5 /100 | #106 | Exceptional $100,534 |
| Northern Europeans | 96.3 /100 | #107 | Exceptional $100,457 |
| Immigrants | South Eastern Asia | 96.0 /100 | #108 | Exceptional $100,283 |
| Immigrants | North Macedonia | 95.6 /100 | #109 | Exceptional $100,101 |
| Immigrants | Afghanistan | 95.3 /100 | #110 | Exceptional $99,977 |
| Chileans | 95.1 /100 | #111 | Exceptional $99,900 |
| Poles | 94.5 /100 | #112 | Exceptional $99,685 |
| Tongans | 94.2 /100 | #113 | Exceptional $99,604 |
| Immigrants | Western Asia | 94.0 /100 | #114 | Exceptional $99,516 |
| Carpatho Rusyns | 93.7 /100 | #115 | Exceptional $99,449 |
| Portuguese | 93.7 /100 | #116 | Exceptional $99,429 |
| Immigrants | Northern Africa | 93.0 /100 | #117 | Exceptional $99,232 |
| Syrians | 92.9 /100 | #118 | Exceptional $99,215 |