South American Indian vs Immigrants from St. Vincent and the Grenadines Median Family Income
COMPARE
South American Indian
Immigrants from St. Vincent and the Grenadines
Median Family Income
Median Family Income Comparison
South American Indians
Immigrants from St. Vincent and the Grenadines
$103,624
MEDIAN FAMILY INCOME
61.9/ 100
METRIC RATING
167th/ 347
METRIC RANK
$90,094
MEDIAN FAMILY INCOME
0.2/ 100
METRIC RATING
275th/ 347
METRIC RANK
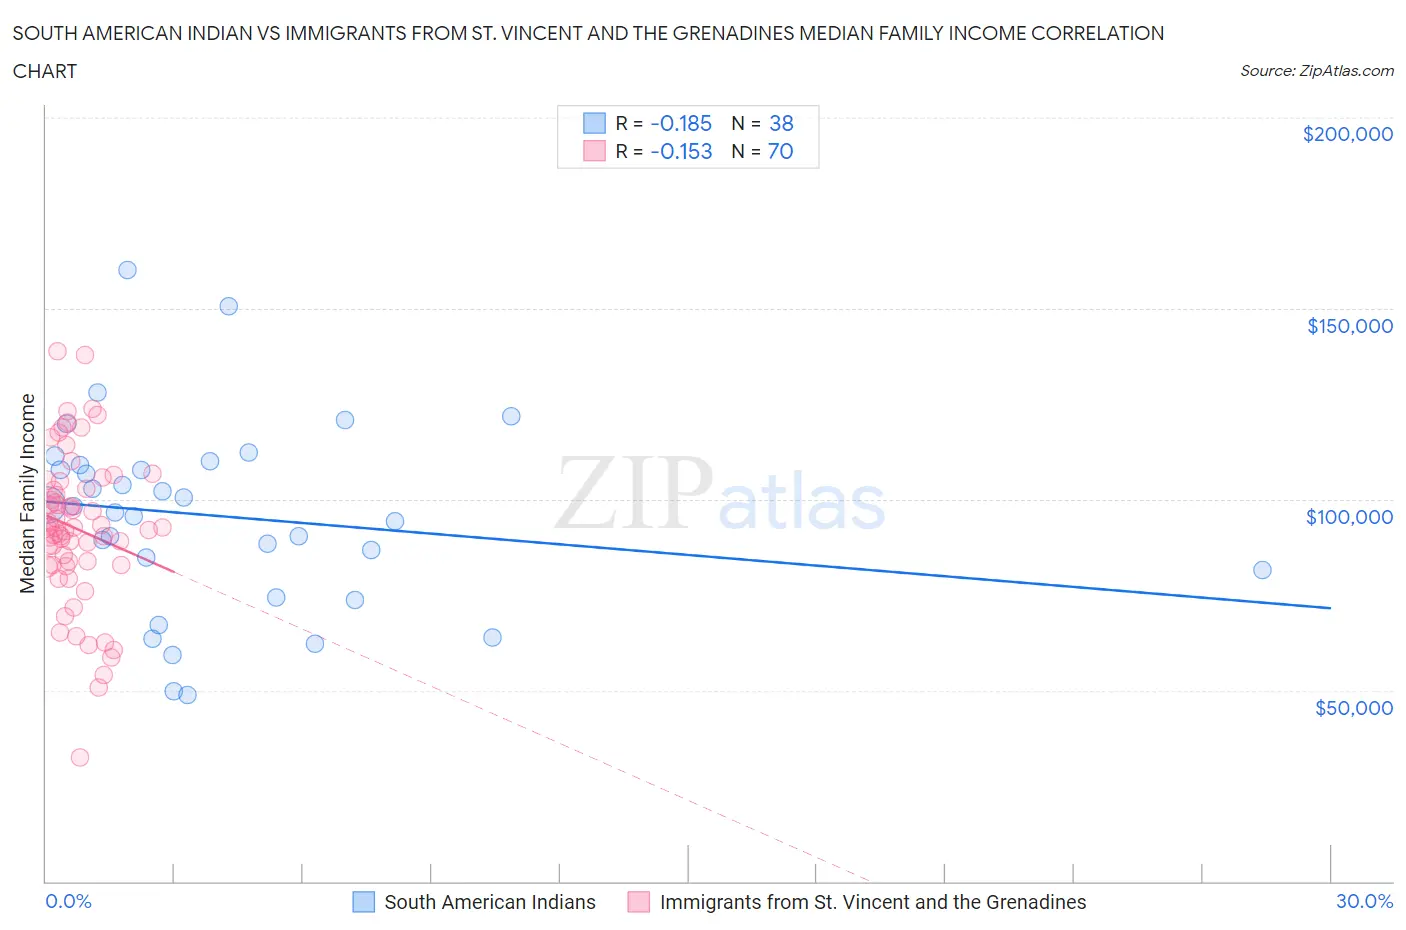
South American Indian vs Immigrants from St. Vincent and the Grenadines Median Family Income Correlation Chart
The statistical analysis conducted on geographies consisting of 164,518,515 people shows a poor negative correlation between the proportion of South American Indians and median family income in the United States with a correlation coefficient (R) of -0.185 and weighted average of $103,624. Similarly, the statistical analysis conducted on geographies consisting of 56,186,074 people shows a poor negative correlation between the proportion of Immigrants from St. Vincent and the Grenadines and median family income in the United States with a correlation coefficient (R) of -0.153 and weighted average of $90,094, a difference of 15.0%.
Median Family Income Correlation Summary
| Measurement | South American Indian | Immigrants from St. Vincent and the Grenadines |
| Minimum | $48,893 | $32,289 |
| Maximum | $160,228 | $138,717 |
| Range | $111,335 | $106,428 |
| Mean | $95,594 | $92,358 |
| Median | $97,421 | $92,624 |
| Interquartile 25% (IQ1) | $81,563 | $82,866 |
| Interquartile 75% (IQ3) | $109,158 | $102,687 |
| Interquartile Range (IQR) | $27,595 | $19,821 |
| Standard Deviation (Sample) | $24,795 | $19,859 |
| Standard Deviation (Population) | $24,467 | $19,717 |
Similar Demographics by Median Family Income
Demographics Similar to South American Indians by Median Family Income
In terms of median family income, the demographic groups most similar to South American Indians are English ($103,684, a difference of 0.060%), Immigrants from Peru ($103,534, a difference of 0.090%), Slovak ($103,729, a difference of 0.10%), Sierra Leonean ($103,859, a difference of 0.23%), and Czechoslovakian ($103,273, a difference of 0.34%).
| Demographics | Rating | Rank | Median Family Income |
| Scottish | 69.5 /100 | #160 | Good $104,288 |
| Icelanders | 69.4 /100 | #161 | Good $104,282 |
| Immigrants | Sierra Leone | 66.2 /100 | #162 | Good $103,990 |
| Costa Ricans | 66.2 /100 | #163 | Good $103,989 |
| Sierra Leoneans | 64.7 /100 | #164 | Good $103,859 |
| Slovaks | 63.1 /100 | #165 | Good $103,729 |
| English | 62.6 /100 | #166 | Good $103,684 |
| South American Indians | 61.9 /100 | #167 | Good $103,624 |
| Immigrants | Peru | 60.8 /100 | #168 | Good $103,534 |
| Czechoslovakians | 57.6 /100 | #169 | Average $103,273 |
| Immigrants | Uzbekistan | 56.6 /100 | #170 | Average $103,197 |
| Alsatians | 54.3 /100 | #171 | Average $103,010 |
| Immigrants | Eritrea | 51.9 /100 | #172 | Average $102,823 |
| Belgians | 51.4 /100 | #173 | Average $102,788 |
| Finns | 50.0 /100 | #174 | Average $102,676 |
Demographics Similar to Immigrants from St. Vincent and the Grenadines by Median Family Income
In terms of median family income, the demographic groups most similar to Immigrants from St. Vincent and the Grenadines are Spanish American ($90,322, a difference of 0.25%), Immigrants from Micronesia ($90,345, a difference of 0.28%), Immigrants from Liberia ($90,450, a difference of 0.40%), Iroquois ($90,543, a difference of 0.50%), and Jamaican ($90,581, a difference of 0.54%).
| Demographics | Rating | Rank | Median Family Income |
| Cree | 0.2 /100 | #268 | Tragic $90,882 |
| Belizeans | 0.2 /100 | #269 | Tragic $90,880 |
| Jamaicans | 0.2 /100 | #270 | Tragic $90,581 |
| Iroquois | 0.2 /100 | #271 | Tragic $90,543 |
| Immigrants | Liberia | 0.2 /100 | #272 | Tragic $90,450 |
| Immigrants | Micronesia | 0.2 /100 | #273 | Tragic $90,345 |
| Spanish Americans | 0.2 /100 | #274 | Tragic $90,322 |
| Immigrants | St. Vincent and the Grenadines | 0.2 /100 | #275 | Tragic $90,094 |
| Immigrants | Zaire | 0.1 /100 | #276 | Tragic $89,285 |
| Immigrants | Jamaica | 0.1 /100 | #277 | Tragic $89,268 |
| Immigrants | Grenada | 0.1 /100 | #278 | Tragic $89,249 |
| Immigrants | Belize | 0.1 /100 | #279 | Tragic $89,197 |
| British West Indians | 0.1 /100 | #280 | Tragic $88,987 |
| Blackfeet | 0.1 /100 | #281 | Tragic $88,717 |
| Comanche | 0.1 /100 | #282 | Tragic $88,556 |