Mexican American Indian vs Chilean Median Family Income
COMPARE
Mexican American Indian
Chilean
Median Family Income
Median Family Income Comparison
Mexican American Indians
Chileans
$90,918
MEDIAN FAMILY INCOME
0.2/ 100
METRIC RATING
267th/ 347
METRIC RANK
$108,429
MEDIAN FAMILY INCOME
95.0/ 100
METRIC RATING
116th/ 347
METRIC RANK
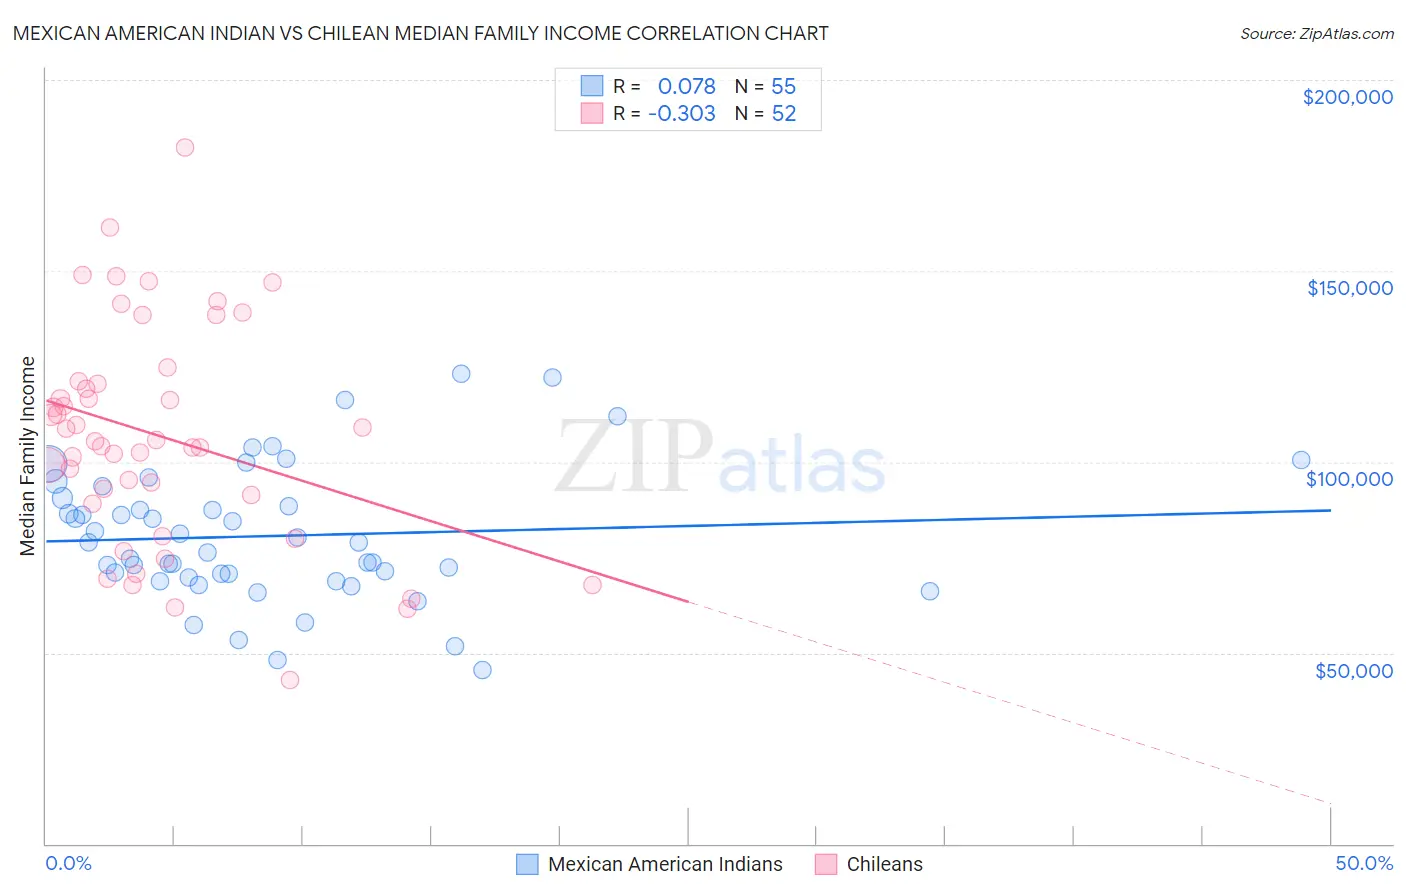
Mexican American Indian vs Chilean Median Family Income Correlation Chart
The statistical analysis conducted on geographies consisting of 317,461,685 people shows a slight positive correlation between the proportion of Mexican American Indians and median family income in the United States with a correlation coefficient (R) of 0.078 and weighted average of $90,918. Similarly, the statistical analysis conducted on geographies consisting of 256,482,123 people shows a mild negative correlation between the proportion of Chileans and median family income in the United States with a correlation coefficient (R) of -0.303 and weighted average of $108,429, a difference of 19.3%.
Median Family Income Correlation Summary
| Measurement | Mexican American Indian | Chilean |
| Minimum | $45,568 | $42,833 |
| Maximum | $122,917 | $182,212 |
| Range | $77,349 | $139,379 |
| Mean | $80,601 | $106,873 |
| Median | $78,819 | $105,526 |
| Interquartile 25% (IQ1) | $69,567 | $90,247 |
| Interquartile 75% (IQ3) | $90,530 | $120,874 |
| Interquartile Range (IQR) | $20,964 | $30,627 |
| Standard Deviation (Sample) | $17,524 | $28,929 |
| Standard Deviation (Population) | $17,364 | $28,649 |
Similar Demographics by Median Family Income
Demographics Similar to Mexican American Indians by Median Family Income
In terms of median family income, the demographic groups most similar to Mexican American Indians are Cree ($90,882, a difference of 0.040%), Belizean ($90,880, a difference of 0.040%), Central American ($91,087, a difference of 0.19%), Jamaican ($90,581, a difference of 0.37%), and Iroquois ($90,543, a difference of 0.41%).
| Demographics | Rating | Rank | Median Family Income |
| Pennsylvania Germans | 0.4 /100 | #260 | Tragic $91,763 |
| Inupiat | 0.4 /100 | #261 | Tragic $91,730 |
| Liberians | 0.4 /100 | #262 | Tragic $91,722 |
| Immigrants | West Indies | 0.3 /100 | #263 | Tragic $91,588 |
| Senegalese | 0.3 /100 | #264 | Tragic $91,475 |
| Hmong | 0.3 /100 | #265 | Tragic $91,296 |
| Central Americans | 0.3 /100 | #266 | Tragic $91,087 |
| Mexican American Indians | 0.2 /100 | #267 | Tragic $90,918 |
| Cree | 0.2 /100 | #268 | Tragic $90,882 |
| Belizeans | 0.2 /100 | #269 | Tragic $90,880 |
| Jamaicans | 0.2 /100 | #270 | Tragic $90,581 |
| Iroquois | 0.2 /100 | #271 | Tragic $90,543 |
| Immigrants | Liberia | 0.2 /100 | #272 | Tragic $90,450 |
| Immigrants | Micronesia | 0.2 /100 | #273 | Tragic $90,345 |
| Spanish Americans | 0.2 /100 | #274 | Tragic $90,322 |
Demographics Similar to Chileans by Median Family Income
In terms of median family income, the demographic groups most similar to Chileans are Swedish ($108,499, a difference of 0.060%), Polish ($108,507, a difference of 0.070%), Immigrants from Saudi Arabia ($108,544, a difference of 0.11%), Immigrants from Poland ($108,570, a difference of 0.13%), and Immigrants from Philippines ($108,288, a difference of 0.13%).
| Demographics | Rating | Rank | Median Family Income |
| Immigrants | Afghanistan | 95.6 /100 | #109 | Exceptional $108,709 |
| British | 95.6 /100 | #110 | Exceptional $108,705 |
| Immigrants | Western Asia | 95.6 /100 | #111 | Exceptional $108,691 |
| Immigrants | Poland | 95.3 /100 | #112 | Exceptional $108,570 |
| Immigrants | Saudi Arabia | 95.2 /100 | #113 | Exceptional $108,544 |
| Poles | 95.2 /100 | #114 | Exceptional $108,507 |
| Swedes | 95.1 /100 | #115 | Exceptional $108,499 |
| Chileans | 95.0 /100 | #116 | Exceptional $108,429 |
| Immigrants | Philippines | 94.6 /100 | #117 | Exceptional $108,288 |
| Ethiopians | 94.5 /100 | #118 | Exceptional $108,251 |
| Sri Lankans | 94.5 /100 | #119 | Exceptional $108,234 |
| Immigrants | Northern Africa | 94.3 /100 | #120 | Exceptional $108,161 |
| Europeans | 94.1 /100 | #121 | Exceptional $108,099 |
| Immigrants | Jordan | 92.9 /100 | #122 | Exceptional $107,715 |
| Carpatho Rusyns | 92.2 /100 | #123 | Exceptional $107,502 |