Somali vs Soviet Union College, 1 year or more
COMPARE
Somali
Soviet Union
College, 1 year or more
College, 1 year or more Comparison
Somalis
Soviet Union
59.9%
COLLEGE, 1 YEAR OR MORE
64.5/ 100
METRIC RATING
161st/ 347
METRIC RANK
66.4%
COLLEGE, 1 YEAR OR MORE
100.0/ 100
METRIC RATING
22nd/ 347
METRIC RANK
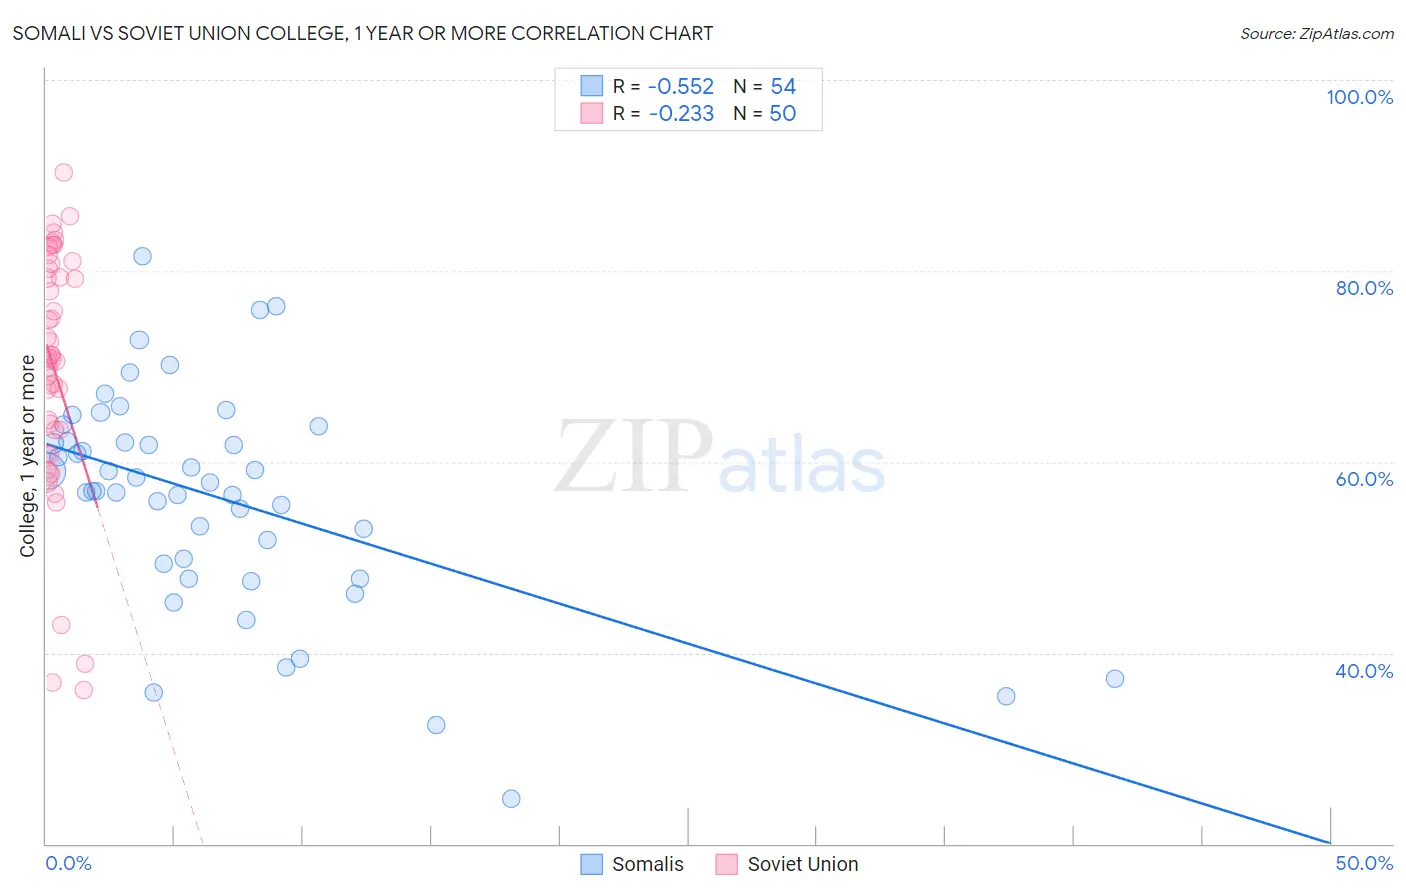
Somali vs Soviet Union College, 1 year or more Correlation Chart
The statistical analysis conducted on geographies consisting of 99,332,457 people shows a substantial negative correlation between the proportion of Somalis and percentage of population with at least college, 1 year or more education in the United States with a correlation coefficient (R) of -0.552 and weighted average of 59.9%. Similarly, the statistical analysis conducted on geographies consisting of 43,514,626 people shows a weak negative correlation between the proportion of Soviet Union and percentage of population with at least college, 1 year or more education in the United States with a correlation coefficient (R) of -0.233 and weighted average of 66.4%, a difference of 10.9%.
College, 1 year or more Correlation Summary
| Measurement | Somali | Soviet Union |
| Minimum | 24.7% | 36.1% |
| Maximum | 81.5% | 90.4% |
| Range | 56.8% | 54.3% |
| Mean | 56.2% | 69.7% |
| Median | 57.4% | 70.9% |
| Interquartile 25% (IQ1) | 49.3% | 63.3% |
| Interquartile 75% (IQ3) | 62.1% | 80.2% |
| Interquartile Range (IQR) | 12.9% | 16.9% |
| Standard Deviation (Sample) | 11.5% | 12.8% |
| Standard Deviation (Population) | 11.4% | 12.6% |
Similar Demographics by College, 1 year or more
Demographics Similar to Somalis by College, 1 year or more
In terms of college, 1 year or more, the demographic groups most similar to Somalis are South American Indian (60.0%, a difference of 0.14%), English (60.0%, a difference of 0.15%), Immigrants from Iraq (60.0%, a difference of 0.15%), Immigrants from Armenia (60.0%, a difference of 0.25%), and Korean (59.7%, a difference of 0.34%).
| Demographics | Rating | Rank | College, 1 year or more |
| Sudanese | 73.0 /100 | #154 | Good 60.2% |
| Moroccans | 72.9 /100 | #155 | Good 60.2% |
| Finns | 72.9 /100 | #156 | Good 60.2% |
| Immigrants | Armenia | 68.8 /100 | #157 | Good 60.0% |
| English | 67.2 /100 | #158 | Good 60.0% |
| Immigrants | Iraq | 67.0 /100 | #159 | Good 60.0% |
| South American Indians | 66.9 /100 | #160 | Good 60.0% |
| Somalis | 64.5 /100 | #161 | Good 59.9% |
| Koreans | 58.5 /100 | #162 | Average 59.7% |
| Immigrants | Somalia | 58.3 /100 | #163 | Average 59.7% |
| Belgians | 58.1 /100 | #164 | Average 59.7% |
| Irish | 56.1 /100 | #165 | Average 59.6% |
| Immigrants | Africa | 56.1 /100 | #166 | Average 59.6% |
| Immigrants | North Macedonia | 53.1 /100 | #167 | Average 59.5% |
| Hungarians | 52.9 /100 | #168 | Average 59.5% |
Demographics Similar to Soviet Union by College, 1 year or more
In terms of college, 1 year or more, the demographic groups most similar to Soviet Union are Immigrants from Hong Kong (66.4%, a difference of 0.060%), Immigrants from China (66.4%, a difference of 0.060%), Immigrants from Korea (66.5%, a difference of 0.13%), Immigrants from Belgium (66.3%, a difference of 0.14%), and Immigrants from Switzerland (66.5%, a difference of 0.17%).
| Demographics | Rating | Rank | College, 1 year or more |
| Cambodians | 100.0 /100 | #15 | Exceptional 66.7% |
| Immigrants | Japan | 100.0 /100 | #16 | Exceptional 66.7% |
| Immigrants | Eastern Asia | 100.0 /100 | #17 | Exceptional 66.6% |
| Eastern Europeans | 100.0 /100 | #18 | Exceptional 66.6% |
| Immigrants | Switzerland | 100.0 /100 | #19 | Exceptional 66.5% |
| Immigrants | Korea | 100.0 /100 | #20 | Exceptional 66.5% |
| Immigrants | Hong Kong | 100.0 /100 | #21 | Exceptional 66.4% |
| Soviet Union | 100.0 /100 | #22 | Exceptional 66.4% |
| Immigrants | China | 100.0 /100 | #23 | Exceptional 66.4% |
| Immigrants | Belgium | 100.0 /100 | #24 | Exceptional 66.3% |
| Indians (Asian) | 100.0 /100 | #25 | Exceptional 66.1% |
| Latvians | 100.0 /100 | #26 | Exceptional 66.1% |
| Immigrants | Ireland | 100.0 /100 | #27 | Exceptional 65.9% |
| Immigrants | France | 100.0 /100 | #28 | Exceptional 65.8% |
| Immigrants | Northern Europe | 100.0 /100 | #29 | Exceptional 65.6% |