Slovene vs Sioux Per Capita Income
COMPARE
Slovene
Sioux
Per Capita Income
Per Capita Income Comparison
Slovenes
Sioux
$45,581
PER CAPITA INCOME
89.6/ 100
METRIC RATING
134th/ 347
METRIC RANK
$33,921
PER CAPITA INCOME
0.0/ 100
METRIC RATING
332nd/ 347
METRIC RANK
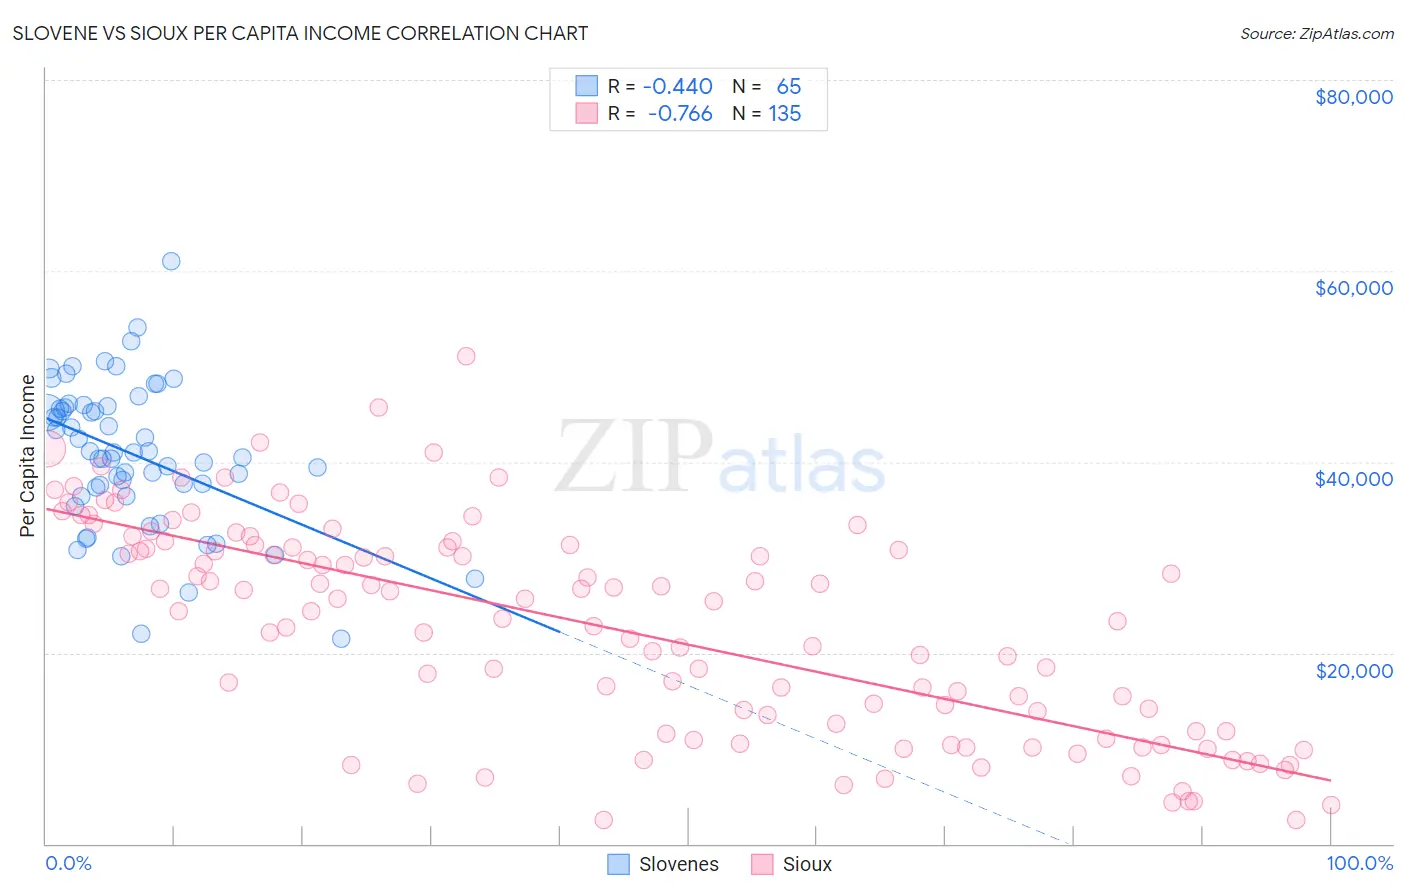
Slovene vs Sioux Per Capita Income Correlation Chart
The statistical analysis conducted on geographies consisting of 261,356,467 people shows a moderate negative correlation between the proportion of Slovenes and per capita income in the United States with a correlation coefficient (R) of -0.440 and weighted average of $45,581. Similarly, the statistical analysis conducted on geographies consisting of 234,205,555 people shows a strong negative correlation between the proportion of Sioux and per capita income in the United States with a correlation coefficient (R) of -0.766 and weighted average of $33,921, a difference of 34.4%.
Per Capita Income Correlation Summary
| Measurement | Slovene | Sioux |
| Minimum | $21,418 | $2,521 |
| Maximum | $60,978 | $51,123 |
| Range | $39,560 | $48,602 |
| Mean | $40,788 | $22,691 |
| Median | $40,958 | $24,396 |
| Interquartile 25% (IQ1) | $36,844 | $11,727 |
| Interquartile 75% (IQ3) | $45,760 | $31,249 |
| Interquartile Range (IQR) | $8,915 | $19,522 |
| Standard Deviation (Sample) | $7,597 | $11,145 |
| Standard Deviation (Population) | $7,538 | $11,104 |
Similar Demographics by Per Capita Income
Demographics Similar to Slovenes by Per Capita Income
In terms of per capita income, the demographic groups most similar to Slovenes are Pakistani ($45,587, a difference of 0.010%), Jordanian ($45,605, a difference of 0.050%), Immigrants from North Macedonia ($45,622, a difference of 0.090%), Luxembourger ($45,663, a difference of 0.18%), and Arab ($45,662, a difference of 0.18%).
| Demographics | Rating | Rank | Per Capita Income |
| Immigrants | Germany | 91.3 /100 | #127 | Exceptional $45,751 |
| Swedes | 91.3 /100 | #128 | Exceptional $45,750 |
| Luxembourgers | 90.4 /100 | #129 | Exceptional $45,663 |
| Arabs | 90.4 /100 | #130 | Exceptional $45,662 |
| Immigrants | North Macedonia | 90.0 /100 | #131 | Exceptional $45,622 |
| Jordanians | 89.9 /100 | #132 | Excellent $45,605 |
| Pakistanis | 89.7 /100 | #133 | Excellent $45,587 |
| Slovenes | 89.6 /100 | #134 | Excellent $45,581 |
| Hungarians | 87.9 /100 | #135 | Excellent $45,426 |
| Immigrants | Oceania | 85.2 /100 | #136 | Excellent $45,220 |
| Immigrants | Syria | 85.2 /100 | #137 | Excellent $45,218 |
| Assyrians/Chaldeans/Syriacs | 84.8 /100 | #138 | Excellent $45,195 |
| Basques | 83.2 /100 | #139 | Excellent $45,086 |
| Immigrants | Jordan | 82.9 /100 | #140 | Excellent $45,066 |
| Slavs | 82.6 /100 | #141 | Excellent $45,049 |
Demographics Similar to Sioux by Per Capita Income
In terms of per capita income, the demographic groups most similar to Sioux are Immigrants from Mexico ($33,931, a difference of 0.030%), Immigrants from Yemen ($33,696, a difference of 0.67%), Spanish American Indian ($34,195, a difference of 0.81%), Mexican ($34,559, a difference of 1.9%), and Native/Alaskan ($33,279, a difference of 1.9%).
| Demographics | Rating | Rank | Per Capita Income |
| Immigrants | Central America | 0.0 /100 | #325 | Tragic $34,974 |
| Immigrants | Cuba | 0.0 /100 | #326 | Tragic $34,910 |
| Apache | 0.0 /100 | #327 | Tragic $34,886 |
| Menominee | 0.0 /100 | #328 | Tragic $34,578 |
| Mexicans | 0.0 /100 | #329 | Tragic $34,559 |
| Spanish American Indians | 0.0 /100 | #330 | Tragic $34,195 |
| Immigrants | Mexico | 0.0 /100 | #331 | Tragic $33,931 |
| Sioux | 0.0 /100 | #332 | Tragic $33,921 |
| Immigrants | Yemen | 0.0 /100 | #333 | Tragic $33,696 |
| Natives/Alaskans | 0.0 /100 | #334 | Tragic $33,279 |
| Yuman | 0.0 /100 | #335 | Tragic $33,236 |
| Yakama | 0.0 /100 | #336 | Tragic $33,009 |
| Houma | 0.0 /100 | #337 | Tragic $32,996 |
| Arapaho | 0.0 /100 | #338 | Tragic $32,345 |
| Pueblo | 0.0 /100 | #339 | Tragic $32,012 |