Slovene vs Immigrants from Belarus Per Capita Income
COMPARE
Slovene
Immigrants from Belarus
Per Capita Income
Per Capita Income Comparison
Slovenes
Immigrants from Belarus
$45,581
PER CAPITA INCOME
89.6/ 100
METRIC RATING
134th/ 347
METRIC RANK
$50,303
PER CAPITA INCOME
99.9/ 100
METRIC RATING
54th/ 347
METRIC RANK
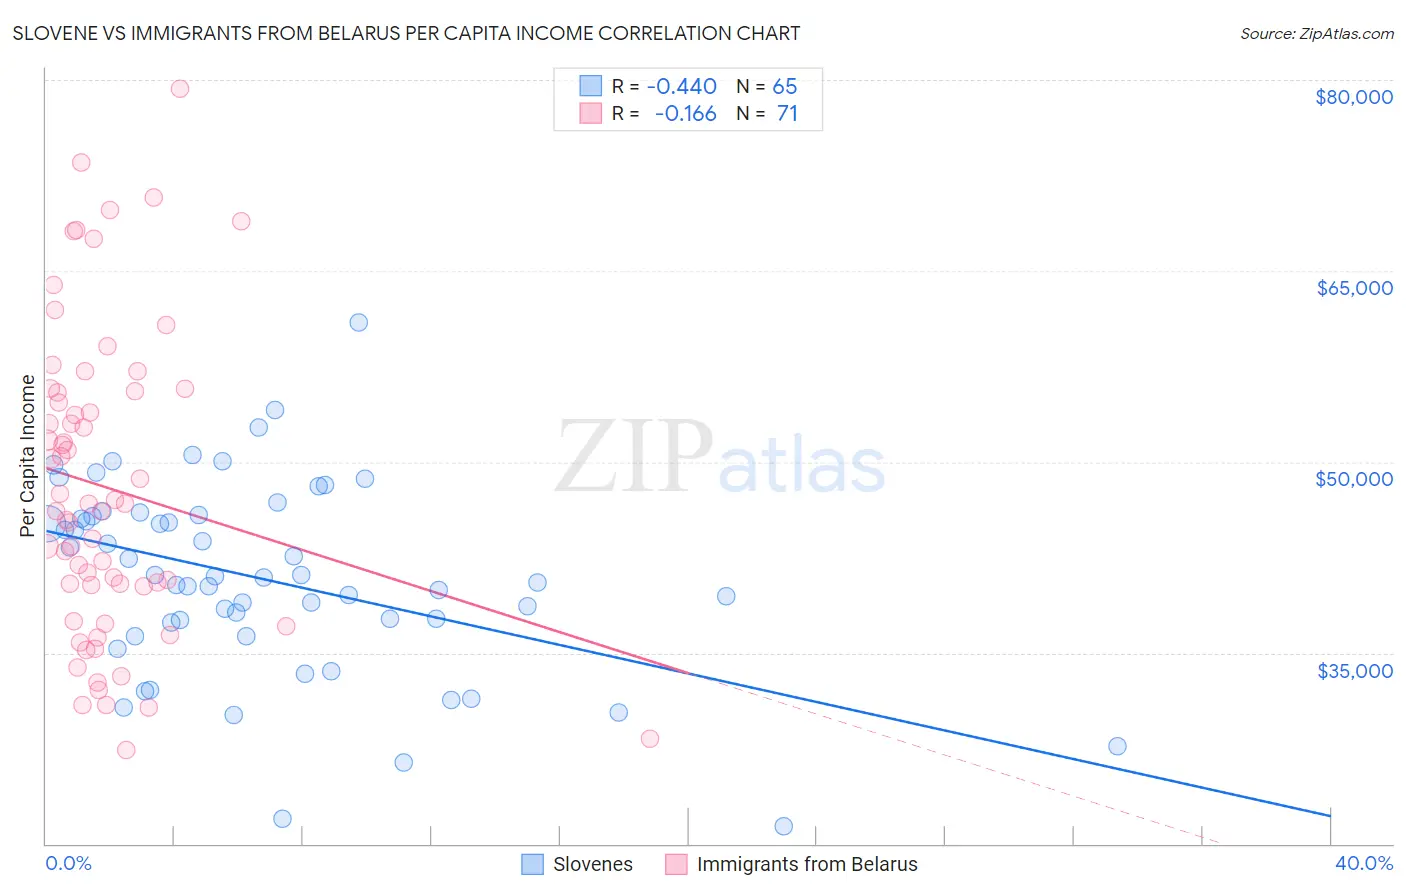
Slovene vs Immigrants from Belarus Per Capita Income Correlation Chart
The statistical analysis conducted on geographies consisting of 261,356,467 people shows a moderate negative correlation between the proportion of Slovenes and per capita income in the United States with a correlation coefficient (R) of -0.440 and weighted average of $45,581. Similarly, the statistical analysis conducted on geographies consisting of 150,188,651 people shows a poor negative correlation between the proportion of Immigrants from Belarus and per capita income in the United States with a correlation coefficient (R) of -0.166 and weighted average of $50,303, a difference of 10.4%.
Per Capita Income Correlation Summary
| Measurement | Slovene | Immigrants from Belarus |
| Minimum | $21,418 | $27,382 |
| Maximum | $60,978 | $79,346 |
| Range | $39,560 | $51,964 |
| Mean | $40,788 | $47,977 |
| Median | $40,958 | $46,691 |
| Interquartile 25% (IQ1) | $36,844 | $40,275 |
| Interquartile 75% (IQ3) | $45,760 | $55,569 |
| Interquartile Range (IQR) | $8,915 | $15,294 |
| Standard Deviation (Sample) | $7,597 | $11,980 |
| Standard Deviation (Population) | $7,538 | $11,895 |
Similar Demographics by Per Capita Income
Demographics Similar to Slovenes by Per Capita Income
In terms of per capita income, the demographic groups most similar to Slovenes are Pakistani ($45,587, a difference of 0.010%), Jordanian ($45,605, a difference of 0.050%), Immigrants from North Macedonia ($45,622, a difference of 0.090%), Luxembourger ($45,663, a difference of 0.18%), and Arab ($45,662, a difference of 0.18%).
| Demographics | Rating | Rank | Per Capita Income |
| Immigrants | Germany | 91.3 /100 | #127 | Exceptional $45,751 |
| Swedes | 91.3 /100 | #128 | Exceptional $45,750 |
| Luxembourgers | 90.4 /100 | #129 | Exceptional $45,663 |
| Arabs | 90.4 /100 | #130 | Exceptional $45,662 |
| Immigrants | North Macedonia | 90.0 /100 | #131 | Exceptional $45,622 |
| Jordanians | 89.9 /100 | #132 | Excellent $45,605 |
| Pakistanis | 89.7 /100 | #133 | Excellent $45,587 |
| Slovenes | 89.6 /100 | #134 | Excellent $45,581 |
| Hungarians | 87.9 /100 | #135 | Excellent $45,426 |
| Immigrants | Oceania | 85.2 /100 | #136 | Excellent $45,220 |
| Immigrants | Syria | 85.2 /100 | #137 | Excellent $45,218 |
| Assyrians/Chaldeans/Syriacs | 84.8 /100 | #138 | Excellent $45,195 |
| Basques | 83.2 /100 | #139 | Excellent $45,086 |
| Immigrants | Jordan | 82.9 /100 | #140 | Excellent $45,066 |
| Slavs | 82.6 /100 | #141 | Excellent $45,049 |
Demographics Similar to Immigrants from Belarus by Per Capita Income
In terms of per capita income, the demographic groups most similar to Immigrants from Belarus are Paraguayan ($50,385, a difference of 0.16%), Immigrants from Croatia ($50,417, a difference of 0.23%), Immigrants from Netherlands ($50,458, a difference of 0.31%), Immigrants from Western Europe ($50,065, a difference of 0.48%), and Asian ($50,057, a difference of 0.49%).
| Demographics | Rating | Rank | Per Capita Income |
| Bulgarians | 100.0 /100 | #47 | Exceptional $50,906 |
| Immigrants | Serbia | 100.0 /100 | #48 | Exceptional $50,810 |
| New Zealanders | 100.0 /100 | #49 | Exceptional $50,575 |
| Immigrants | Sri Lanka | 100.0 /100 | #50 | Exceptional $50,555 |
| Immigrants | Netherlands | 100.0 /100 | #51 | Exceptional $50,458 |
| Immigrants | Croatia | 99.9 /100 | #52 | Exceptional $50,417 |
| Paraguayans | 99.9 /100 | #53 | Exceptional $50,385 |
| Immigrants | Belarus | 99.9 /100 | #54 | Exceptional $50,303 |
| Immigrants | Western Europe | 99.9 /100 | #55 | Exceptional $50,065 |
| Asians | 99.9 /100 | #56 | Exceptional $50,057 |
| South Africans | 99.9 /100 | #57 | Exceptional $50,044 |
| Immigrants | Malaysia | 99.9 /100 | #58 | Exceptional $49,983 |
| Bhutanese | 99.9 /100 | #59 | Exceptional $49,894 |
| Immigrants | Scotland | 99.9 /100 | #60 | Exceptional $49,893 |
| Argentineans | 99.9 /100 | #61 | Exceptional $49,862 |