Colville vs Sioux Per Capita Income
COMPARE
Colville
Sioux
Per Capita Income
Per Capita Income Comparison
Colville
Sioux
$38,047
PER CAPITA INCOME
0.2/ 100
METRIC RATING
279th/ 347
METRIC RANK
$33,921
PER CAPITA INCOME
0.0/ 100
METRIC RATING
332nd/ 347
METRIC RANK
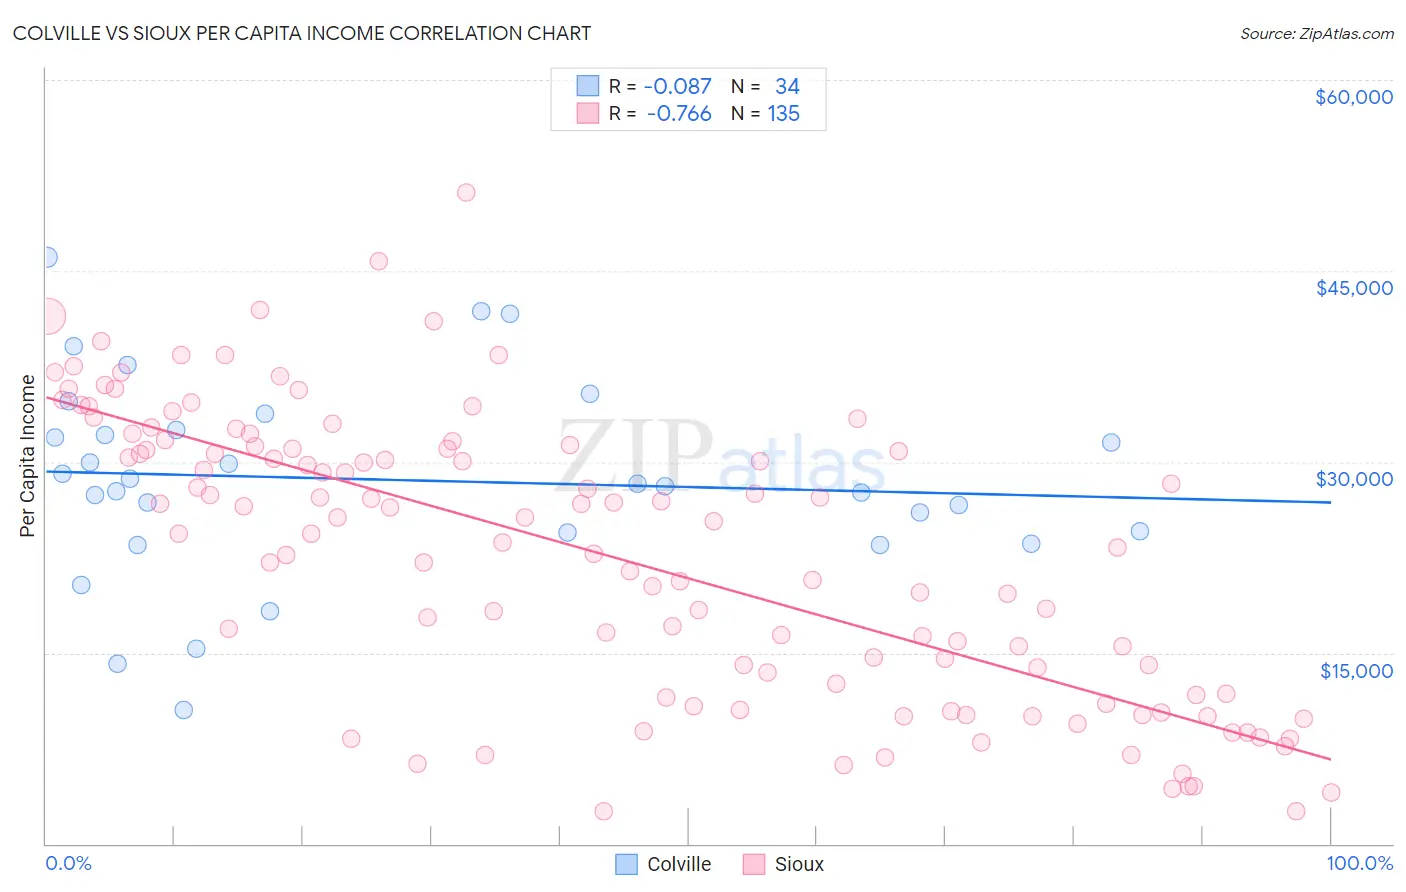
Colville vs Sioux Per Capita Income Correlation Chart
The statistical analysis conducted on geographies consisting of 34,687,707 people shows a slight negative correlation between the proportion of Colville and per capita income in the United States with a correlation coefficient (R) of -0.087 and weighted average of $38,047. Similarly, the statistical analysis conducted on geographies consisting of 234,205,555 people shows a strong negative correlation between the proportion of Sioux and per capita income in the United States with a correlation coefficient (R) of -0.766 and weighted average of $33,921, a difference of 12.2%.
Per Capita Income Correlation Summary
| Measurement | Colville | Sioux |
| Minimum | $10,541 | $2,521 |
| Maximum | $46,065 | $51,123 |
| Range | $35,524 | $48,602 |
| Mean | $28,594 | $22,691 |
| Median | $28,215 | $24,396 |
| Interquartile 25% (IQ1) | $24,418 | $11,727 |
| Interquartile 75% (IQ3) | $32,462 | $31,249 |
| Interquartile Range (IQR) | $8,044 | $19,522 |
| Standard Deviation (Sample) | $7,817 | $11,145 |
| Standard Deviation (Population) | $7,701 | $11,104 |
Similar Demographics by Per Capita Income
Demographics Similar to Colville by Per Capita Income
In terms of per capita income, the demographic groups most similar to Colville are Potawatomi ($38,046, a difference of 0.0%), Immigrants from Nicaragua ($38,065, a difference of 0.050%), Comanche ($38,088, a difference of 0.11%), Hmong ($38,120, a difference of 0.19%), and Immigrants from Dominica ($37,952, a difference of 0.25%).
| Demographics | Rating | Rank | Per Capita Income |
| Immigrants | Cabo Verde | 0.3 /100 | #272 | Tragic $38,540 |
| Nepalese | 0.3 /100 | #273 | Tragic $38,442 |
| Immigrants | El Salvador | 0.3 /100 | #274 | Tragic $38,394 |
| Immigrants | Liberia | 0.2 /100 | #275 | Tragic $38,165 |
| Hmong | 0.2 /100 | #276 | Tragic $38,120 |
| Comanche | 0.2 /100 | #277 | Tragic $38,088 |
| Immigrants | Nicaragua | 0.2 /100 | #278 | Tragic $38,065 |
| Colville | 0.2 /100 | #279 | Tragic $38,047 |
| Potawatomi | 0.2 /100 | #280 | Tragic $38,046 |
| Immigrants | Dominica | 0.2 /100 | #281 | Tragic $37,952 |
| Immigrants | Laos | 0.1 /100 | #282 | Tragic $37,857 |
| Pennsylvania Germans | 0.1 /100 | #283 | Tragic $37,842 |
| Africans | 0.1 /100 | #284 | Tragic $37,785 |
| Guatemalans | 0.1 /100 | #285 | Tragic $37,766 |
| Central American Indians | 0.1 /100 | #286 | Tragic $37,699 |
Demographics Similar to Sioux by Per Capita Income
In terms of per capita income, the demographic groups most similar to Sioux are Immigrants from Mexico ($33,931, a difference of 0.030%), Immigrants from Yemen ($33,696, a difference of 0.67%), Spanish American Indian ($34,195, a difference of 0.81%), Mexican ($34,559, a difference of 1.9%), and Native/Alaskan ($33,279, a difference of 1.9%).
| Demographics | Rating | Rank | Per Capita Income |
| Immigrants | Central America | 0.0 /100 | #325 | Tragic $34,974 |
| Immigrants | Cuba | 0.0 /100 | #326 | Tragic $34,910 |
| Apache | 0.0 /100 | #327 | Tragic $34,886 |
| Menominee | 0.0 /100 | #328 | Tragic $34,578 |
| Mexicans | 0.0 /100 | #329 | Tragic $34,559 |
| Spanish American Indians | 0.0 /100 | #330 | Tragic $34,195 |
| Immigrants | Mexico | 0.0 /100 | #331 | Tragic $33,931 |
| Sioux | 0.0 /100 | #332 | Tragic $33,921 |
| Immigrants | Yemen | 0.0 /100 | #333 | Tragic $33,696 |
| Natives/Alaskans | 0.0 /100 | #334 | Tragic $33,279 |
| Yuman | 0.0 /100 | #335 | Tragic $33,236 |
| Yakama | 0.0 /100 | #336 | Tragic $33,009 |
| Houma | 0.0 /100 | #337 | Tragic $32,996 |
| Arapaho | 0.0 /100 | #338 | Tragic $32,345 |
| Pueblo | 0.0 /100 | #339 | Tragic $32,012 |