Slovene vs Immigrants from Laos Per Capita Income
COMPARE
Slovene
Immigrants from Laos
Per Capita Income
Per Capita Income Comparison
Slovenes
Immigrants from Laos
$45,581
PER CAPITA INCOME
89.6/ 100
METRIC RATING
134th/ 347
METRIC RANK
$37,857
PER CAPITA INCOME
0.1/ 100
METRIC RATING
282nd/ 347
METRIC RANK
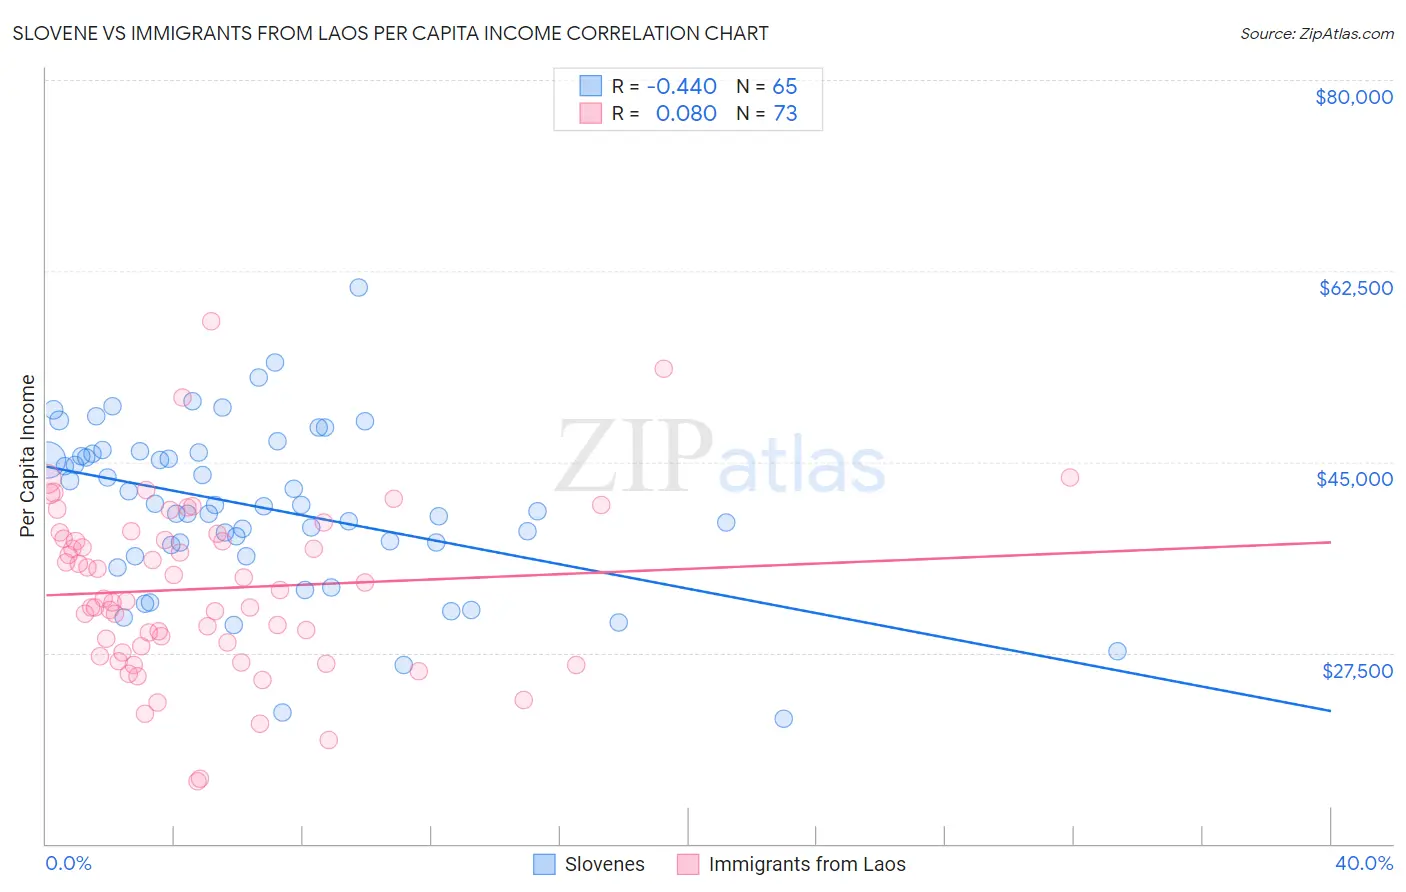
Slovene vs Immigrants from Laos Per Capita Income Correlation Chart
The statistical analysis conducted on geographies consisting of 261,356,467 people shows a moderate negative correlation between the proportion of Slovenes and per capita income in the United States with a correlation coefficient (R) of -0.440 and weighted average of $45,581. Similarly, the statistical analysis conducted on geographies consisting of 201,476,108 people shows a slight positive correlation between the proportion of Immigrants from Laos and per capita income in the United States with a correlation coefficient (R) of 0.080 and weighted average of $37,857, a difference of 20.4%.
Per Capita Income Correlation Summary
| Measurement | Slovene | Immigrants from Laos |
| Minimum | $21,418 | $15,753 |
| Maximum | $60,978 | $57,923 |
| Range | $39,560 | $42,170 |
| Mean | $40,788 | $33,364 |
| Median | $40,958 | $32,473 |
| Interquartile 25% (IQ1) | $36,844 | $27,819 |
| Interquartile 75% (IQ3) | $45,760 | $38,151 |
| Interquartile Range (IQR) | $8,915 | $10,332 |
| Standard Deviation (Sample) | $7,597 | $7,853 |
| Standard Deviation (Population) | $7,538 | $7,799 |
Similar Demographics by Per Capita Income
Demographics Similar to Slovenes by Per Capita Income
In terms of per capita income, the demographic groups most similar to Slovenes are Pakistani ($45,587, a difference of 0.010%), Jordanian ($45,605, a difference of 0.050%), Immigrants from North Macedonia ($45,622, a difference of 0.090%), Luxembourger ($45,663, a difference of 0.18%), and Arab ($45,662, a difference of 0.18%).
| Demographics | Rating | Rank | Per Capita Income |
| Immigrants | Germany | 91.3 /100 | #127 | Exceptional $45,751 |
| Swedes | 91.3 /100 | #128 | Exceptional $45,750 |
| Luxembourgers | 90.4 /100 | #129 | Exceptional $45,663 |
| Arabs | 90.4 /100 | #130 | Exceptional $45,662 |
| Immigrants | North Macedonia | 90.0 /100 | #131 | Exceptional $45,622 |
| Jordanians | 89.9 /100 | #132 | Excellent $45,605 |
| Pakistanis | 89.7 /100 | #133 | Excellent $45,587 |
| Slovenes | 89.6 /100 | #134 | Excellent $45,581 |
| Hungarians | 87.9 /100 | #135 | Excellent $45,426 |
| Immigrants | Oceania | 85.2 /100 | #136 | Excellent $45,220 |
| Immigrants | Syria | 85.2 /100 | #137 | Excellent $45,218 |
| Assyrians/Chaldeans/Syriacs | 84.8 /100 | #138 | Excellent $45,195 |
| Basques | 83.2 /100 | #139 | Excellent $45,086 |
| Immigrants | Jordan | 82.9 /100 | #140 | Excellent $45,066 |
| Slavs | 82.6 /100 | #141 | Excellent $45,049 |
Demographics Similar to Immigrants from Laos by Per Capita Income
In terms of per capita income, the demographic groups most similar to Immigrants from Laos are Pennsylvania German ($37,842, a difference of 0.040%), African ($37,785, a difference of 0.19%), Guatemalan ($37,766, a difference of 0.24%), Immigrants from Dominica ($37,952, a difference of 0.25%), and Central American Indian ($37,699, a difference of 0.42%).
| Demographics | Rating | Rank | Per Capita Income |
| Immigrants | Liberia | 0.2 /100 | #275 | Tragic $38,165 |
| Hmong | 0.2 /100 | #276 | Tragic $38,120 |
| Comanche | 0.2 /100 | #277 | Tragic $38,088 |
| Immigrants | Nicaragua | 0.2 /100 | #278 | Tragic $38,065 |
| Colville | 0.2 /100 | #279 | Tragic $38,047 |
| Potawatomi | 0.2 /100 | #280 | Tragic $38,046 |
| Immigrants | Dominica | 0.2 /100 | #281 | Tragic $37,952 |
| Immigrants | Laos | 0.1 /100 | #282 | Tragic $37,857 |
| Pennsylvania Germans | 0.1 /100 | #283 | Tragic $37,842 |
| Africans | 0.1 /100 | #284 | Tragic $37,785 |
| Guatemalans | 0.1 /100 | #285 | Tragic $37,766 |
| Central American Indians | 0.1 /100 | #286 | Tragic $37,699 |
| Dominicans | 0.1 /100 | #287 | Tragic $37,697 |
| Blackfeet | 0.1 /100 | #288 | Tragic $37,695 |
| U.S. Virgin Islanders | 0.1 /100 | #289 | Tragic $37,589 |