Slovene vs Australian Per Capita Income
COMPARE
Slovene
Australian
Per Capita Income
Per Capita Income Comparison
Slovenes
Australians
$45,581
PER CAPITA INCOME
89.6/ 100
METRIC RATING
134th/ 347
METRIC RANK
$52,074
PER CAPITA INCOME
100.0/ 100
METRIC RATING
33rd/ 347
METRIC RANK
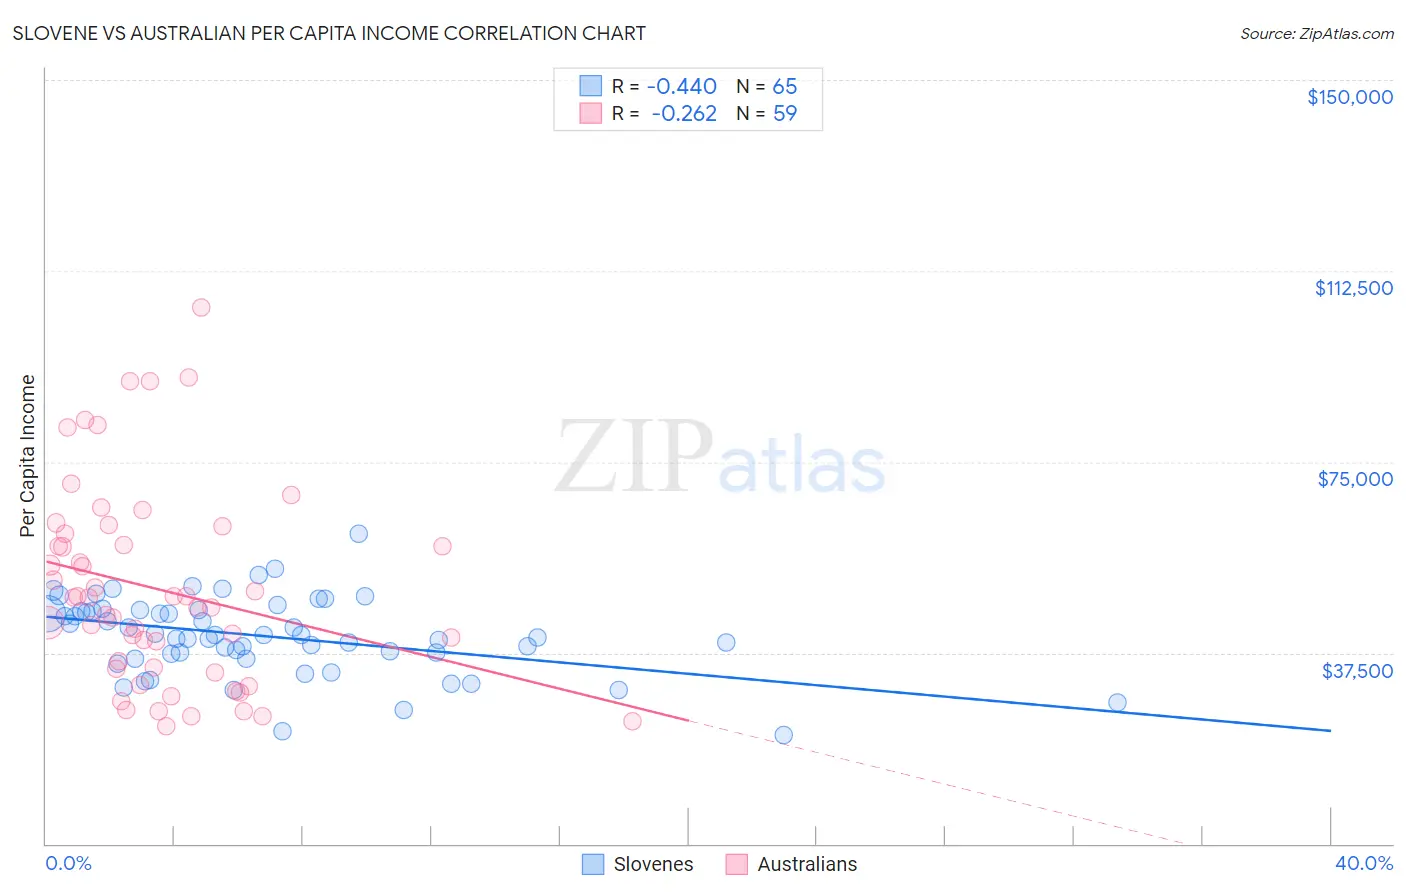
Slovene vs Australian Per Capita Income Correlation Chart
The statistical analysis conducted on geographies consisting of 261,356,467 people shows a moderate negative correlation between the proportion of Slovenes and per capita income in the United States with a correlation coefficient (R) of -0.440 and weighted average of $45,581. Similarly, the statistical analysis conducted on geographies consisting of 224,126,696 people shows a weak negative correlation between the proportion of Australians and per capita income in the United States with a correlation coefficient (R) of -0.262 and weighted average of $52,074, a difference of 14.2%.
Per Capita Income Correlation Summary
| Measurement | Slovene | Australian |
| Minimum | $21,418 | $23,081 |
| Maximum | $60,978 | $105,254 |
| Range | $39,560 | $82,173 |
| Mean | $40,788 | $49,891 |
| Median | $40,958 | $48,296 |
| Interquartile 25% (IQ1) | $36,844 | $34,284 |
| Interquartile 75% (IQ3) | $45,760 | $60,948 |
| Interquartile Range (IQR) | $8,915 | $26,664 |
| Standard Deviation (Sample) | $7,597 | $19,453 |
| Standard Deviation (Population) | $7,538 | $19,287 |
Similar Demographics by Per Capita Income
Demographics Similar to Slovenes by Per Capita Income
In terms of per capita income, the demographic groups most similar to Slovenes are Pakistani ($45,587, a difference of 0.010%), Jordanian ($45,605, a difference of 0.050%), Immigrants from North Macedonia ($45,622, a difference of 0.090%), Luxembourger ($45,663, a difference of 0.18%), and Arab ($45,662, a difference of 0.18%).
| Demographics | Rating | Rank | Per Capita Income |
| Immigrants | Germany | 91.3 /100 | #127 | Exceptional $45,751 |
| Swedes | 91.3 /100 | #128 | Exceptional $45,750 |
| Luxembourgers | 90.4 /100 | #129 | Exceptional $45,663 |
| Arabs | 90.4 /100 | #130 | Exceptional $45,662 |
| Immigrants | North Macedonia | 90.0 /100 | #131 | Exceptional $45,622 |
| Jordanians | 89.9 /100 | #132 | Excellent $45,605 |
| Pakistanis | 89.7 /100 | #133 | Excellent $45,587 |
| Slovenes | 89.6 /100 | #134 | Excellent $45,581 |
| Hungarians | 87.9 /100 | #135 | Excellent $45,426 |
| Immigrants | Oceania | 85.2 /100 | #136 | Excellent $45,220 |
| Immigrants | Syria | 85.2 /100 | #137 | Excellent $45,218 |
| Assyrians/Chaldeans/Syriacs | 84.8 /100 | #138 | Excellent $45,195 |
| Basques | 83.2 /100 | #139 | Excellent $45,086 |
| Immigrants | Jordan | 82.9 /100 | #140 | Excellent $45,066 |
| Slavs | 82.6 /100 | #141 | Excellent $45,049 |
Demographics Similar to Australians by Per Capita Income
In terms of per capita income, the demographic groups most similar to Australians are Immigrants from Russia ($52,044, a difference of 0.060%), Burmese ($52,005, a difference of 0.13%), Immigrants from Norway ($52,217, a difference of 0.27%), Immigrants from Greece ($51,891, a difference of 0.35%), and Estonian ($51,875, a difference of 0.38%).
| Demographics | Rating | Rank | Per Capita Income |
| Russians | 100.0 /100 | #26 | Exceptional $53,154 |
| Immigrants | South Central Asia | 100.0 /100 | #27 | Exceptional $52,660 |
| Latvians | 100.0 /100 | #28 | Exceptional $52,649 |
| Israelis | 100.0 /100 | #29 | Exceptional $52,596 |
| Immigrants | Austria | 100.0 /100 | #30 | Exceptional $52,503 |
| Turks | 100.0 /100 | #31 | Exceptional $52,391 |
| Immigrants | Norway | 100.0 /100 | #32 | Exceptional $52,217 |
| Australians | 100.0 /100 | #33 | Exceptional $52,074 |
| Immigrants | Russia | 100.0 /100 | #34 | Exceptional $52,044 |
| Burmese | 100.0 /100 | #35 | Exceptional $52,005 |
| Immigrants | Greece | 100.0 /100 | #36 | Exceptional $51,891 |
| Estonians | 100.0 /100 | #37 | Exceptional $51,875 |
| Immigrants | Czechoslovakia | 100.0 /100 | #38 | Exceptional $51,770 |
| Cambodians | 100.0 /100 | #39 | Exceptional $51,731 |
| Immigrants | Korea | 100.0 /100 | #40 | Exceptional $51,671 |