Slovene vs Tongan Per Capita Income
COMPARE
Slovene
Tongan
Per Capita Income
Per Capita Income Comparison
Slovenes
Tongans
$45,581
PER CAPITA INCOME
89.6/ 100
METRIC RATING
134th/ 347
METRIC RANK
$41,693
PER CAPITA INCOME
9.9/ 100
METRIC RATING
216th/ 347
METRIC RANK
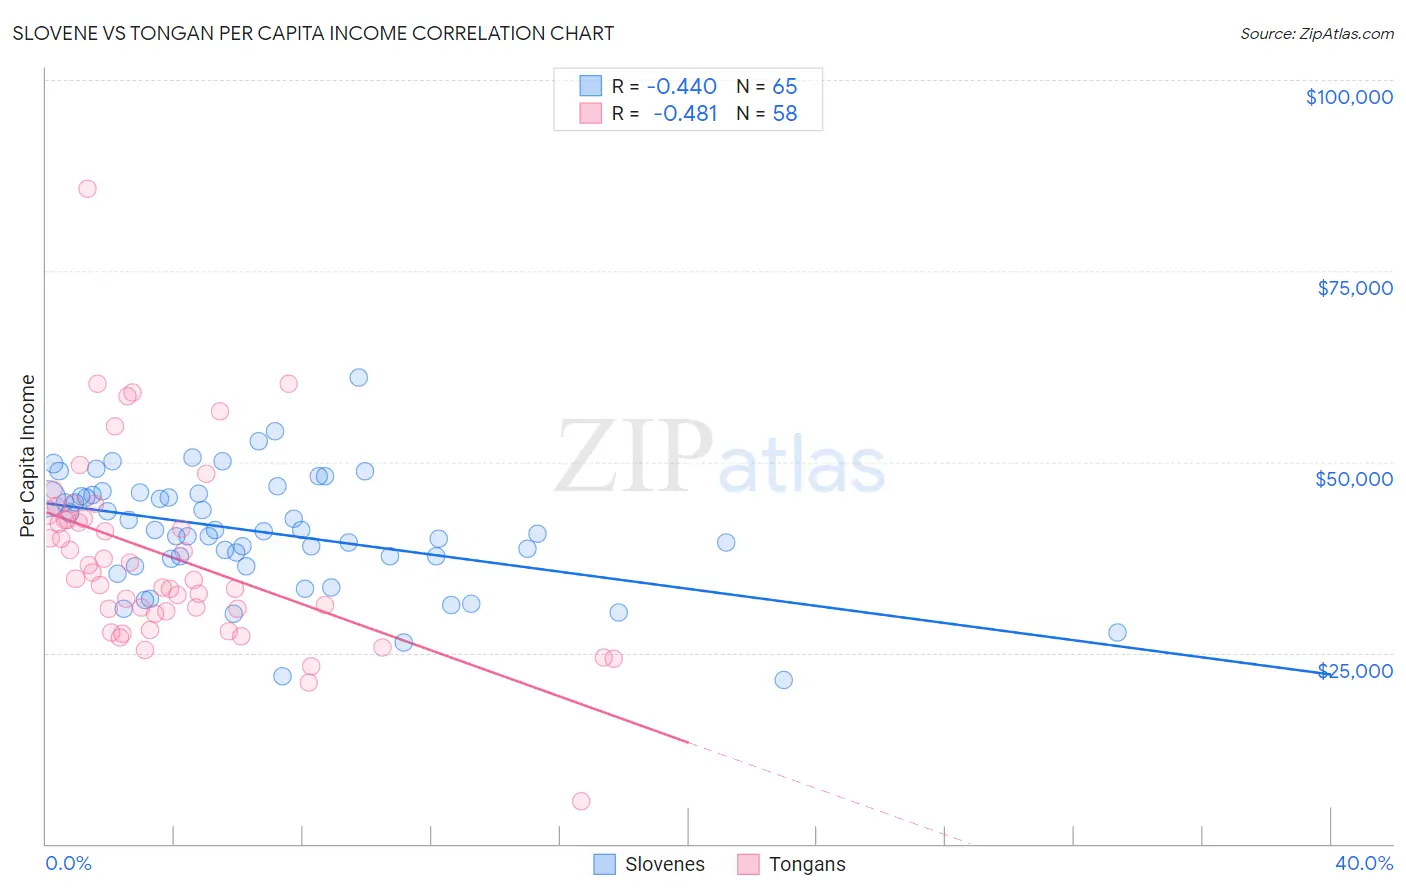
Slovene vs Tongan Per Capita Income Correlation Chart
The statistical analysis conducted on geographies consisting of 261,356,467 people shows a moderate negative correlation between the proportion of Slovenes and per capita income in the United States with a correlation coefficient (R) of -0.440 and weighted average of $45,581. Similarly, the statistical analysis conducted on geographies consisting of 102,908,385 people shows a moderate negative correlation between the proportion of Tongans and per capita income in the United States with a correlation coefficient (R) of -0.481 and weighted average of $41,693, a difference of 9.3%.
Per Capita Income Correlation Summary
| Measurement | Slovene | Tongan |
| Minimum | $21,418 | $5,622 |
| Maximum | $60,978 | $85,704 |
| Range | $39,560 | $80,082 |
| Mean | $40,788 | $37,644 |
| Median | $40,958 | $35,100 |
| Interquartile 25% (IQ1) | $36,844 | $30,397 |
| Interquartile 75% (IQ3) | $45,760 | $42,507 |
| Interquartile Range (IQR) | $8,915 | $12,110 |
| Standard Deviation (Sample) | $7,597 | $12,429 |
| Standard Deviation (Population) | $7,538 | $12,321 |
Similar Demographics by Per Capita Income
Demographics Similar to Slovenes by Per Capita Income
In terms of per capita income, the demographic groups most similar to Slovenes are Pakistani ($45,587, a difference of 0.010%), Jordanian ($45,605, a difference of 0.050%), Immigrants from North Macedonia ($45,622, a difference of 0.090%), Luxembourger ($45,663, a difference of 0.18%), and Arab ($45,662, a difference of 0.18%).
| Demographics | Rating | Rank | Per Capita Income |
| Immigrants | Germany | 91.3 /100 | #127 | Exceptional $45,751 |
| Swedes | 91.3 /100 | #128 | Exceptional $45,750 |
| Luxembourgers | 90.4 /100 | #129 | Exceptional $45,663 |
| Arabs | 90.4 /100 | #130 | Exceptional $45,662 |
| Immigrants | North Macedonia | 90.0 /100 | #131 | Exceptional $45,622 |
| Jordanians | 89.9 /100 | #132 | Excellent $45,605 |
| Pakistanis | 89.7 /100 | #133 | Excellent $45,587 |
| Slovenes | 89.6 /100 | #134 | Excellent $45,581 |
| Hungarians | 87.9 /100 | #135 | Excellent $45,426 |
| Immigrants | Oceania | 85.2 /100 | #136 | Excellent $45,220 |
| Immigrants | Syria | 85.2 /100 | #137 | Excellent $45,218 |
| Assyrians/Chaldeans/Syriacs | 84.8 /100 | #138 | Excellent $45,195 |
| Basques | 83.2 /100 | #139 | Excellent $45,086 |
| Immigrants | Jordan | 82.9 /100 | #140 | Excellent $45,066 |
| Slavs | 82.6 /100 | #141 | Excellent $45,049 |
Demographics Similar to Tongans by Per Capita Income
In terms of per capita income, the demographic groups most similar to Tongans are Sudanese ($41,695, a difference of 0.010%), Guamanian/Chamorro ($41,678, a difference of 0.030%), Immigrants from Bangladesh ($41,709, a difference of 0.040%), Immigrants from Venezuela ($41,727, a difference of 0.080%), and Trinidadian and Tobagonian ($41,655, a difference of 0.090%).
| Demographics | Rating | Rank | Per Capita Income |
| Immigrants | Sudan | 13.2 /100 | #209 | Poor $41,986 |
| Ecuadorians | 12.9 /100 | #210 | Poor $41,958 |
| Immigrants | Panama | 11.6 /100 | #211 | Poor $41,853 |
| Immigrants | Senegal | 11.3 /100 | #212 | Poor $41,830 |
| Immigrants | Venezuela | 10.2 /100 | #213 | Poor $41,727 |
| Immigrants | Bangladesh | 10.1 /100 | #214 | Poor $41,709 |
| Sudanese | 9.9 /100 | #215 | Tragic $41,695 |
| Tongans | 9.9 /100 | #216 | Tragic $41,693 |
| Guamanians/Chamorros | 9.7 /100 | #217 | Tragic $41,678 |
| Trinidadians and Tobagonians | 9.5 /100 | #218 | Tragic $41,655 |
| Puget Sound Salish | 8.1 /100 | #219 | Tragic $41,495 |
| Immigrants | Barbados | 7.9 /100 | #220 | Tragic $41,478 |
| Immigrants | Trinidad and Tobago | 7.9 /100 | #221 | Tragic $41,476 |
| Immigrants | Iraq | 7.1 /100 | #222 | Tragic $41,365 |
| Immigrants | Cameroon | 6.8 /100 | #223 | Tragic $41,334 |