German vs Sioux Per Capita Income
COMPARE
German
Sioux
Per Capita Income
Per Capita Income Comparison
Germans
Sioux
$43,067
PER CAPITA INCOME
33.9/ 100
METRIC RATING
183rd/ 347
METRIC RANK
$33,921
PER CAPITA INCOME
0.0/ 100
METRIC RATING
332nd/ 347
METRIC RANK
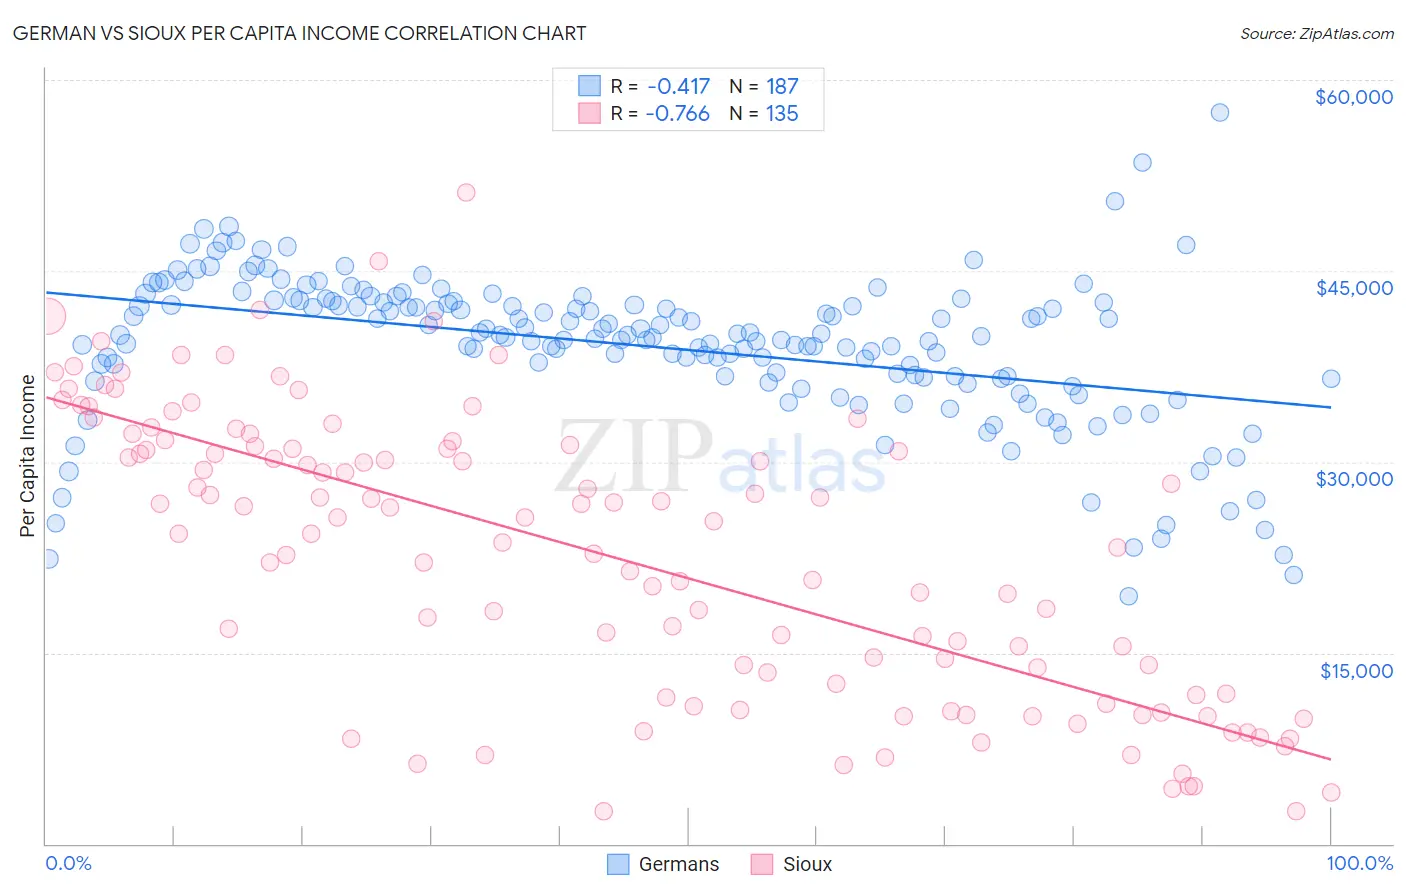
German vs Sioux Per Capita Income Correlation Chart
The statistical analysis conducted on geographies consisting of 581,359,924 people shows a moderate negative correlation between the proportion of Germans and per capita income in the United States with a correlation coefficient (R) of -0.417 and weighted average of $43,067. Similarly, the statistical analysis conducted on geographies consisting of 234,205,555 people shows a strong negative correlation between the proportion of Sioux and per capita income in the United States with a correlation coefficient (R) of -0.766 and weighted average of $33,921, a difference of 27.0%.
Per Capita Income Correlation Summary
| Measurement | German | Sioux |
| Minimum | $19,415 | $2,521 |
| Maximum | $57,467 | $51,123 |
| Range | $38,052 | $48,602 |
| Mean | $39,066 | $22,691 |
| Median | $39,927 | $24,396 |
| Interquartile 25% (IQ1) | $36,606 | $11,727 |
| Interquartile 75% (IQ3) | $42,630 | $31,249 |
| Interquartile Range (IQR) | $6,024 | $19,522 |
| Standard Deviation (Sample) | $5,932 | $11,145 |
| Standard Deviation (Population) | $5,916 | $11,104 |
Similar Demographics by Per Capita Income
Demographics Similar to Germans by Per Capita Income
In terms of per capita income, the demographic groups most similar to Germans are Spaniard ($43,028, a difference of 0.090%), Immigrants ($43,010, a difference of 0.13%), French Canadian ($43,003, a difference of 0.15%), Immigrants from Colombia ($42,971, a difference of 0.22%), and Immigrants from Africa ($42,950, a difference of 0.27%).
| Demographics | Rating | Rank | Per Capita Income |
| Immigrants | South Eastern Asia | 46.6 /100 | #176 | Average $43,539 |
| Tlingit-Haida | 45.9 /100 | #177 | Average $43,516 |
| Immigrants | Costa Rica | 44.5 /100 | #178 | Average $43,464 |
| Finns | 44.4 /100 | #179 | Average $43,461 |
| Sierra Leoneans | 42.9 /100 | #180 | Average $43,405 |
| Welsh | 38.2 /100 | #181 | Fair $43,233 |
| Immigrants | Vietnam | 38.1 /100 | #182 | Fair $43,229 |
| Germans | 33.9 /100 | #183 | Fair $43,067 |
| Spaniards | 32.9 /100 | #184 | Fair $43,028 |
| Immigrants | Immigrants | 32.5 /100 | #185 | Fair $43,010 |
| French Canadians | 32.3 /100 | #186 | Fair $43,003 |
| Immigrants | Colombia | 31.5 /100 | #187 | Fair $42,971 |
| Immigrants | Africa | 31.0 /100 | #188 | Fair $42,950 |
| Bermudans | 30.1 /100 | #189 | Fair $42,911 |
| Kenyans | 27.7 /100 | #190 | Fair $42,808 |
Demographics Similar to Sioux by Per Capita Income
In terms of per capita income, the demographic groups most similar to Sioux are Immigrants from Mexico ($33,931, a difference of 0.030%), Immigrants from Yemen ($33,696, a difference of 0.67%), Spanish American Indian ($34,195, a difference of 0.81%), Mexican ($34,559, a difference of 1.9%), and Native/Alaskan ($33,279, a difference of 1.9%).
| Demographics | Rating | Rank | Per Capita Income |
| Immigrants | Central America | 0.0 /100 | #325 | Tragic $34,974 |
| Immigrants | Cuba | 0.0 /100 | #326 | Tragic $34,910 |
| Apache | 0.0 /100 | #327 | Tragic $34,886 |
| Menominee | 0.0 /100 | #328 | Tragic $34,578 |
| Mexicans | 0.0 /100 | #329 | Tragic $34,559 |
| Spanish American Indians | 0.0 /100 | #330 | Tragic $34,195 |
| Immigrants | Mexico | 0.0 /100 | #331 | Tragic $33,931 |
| Sioux | 0.0 /100 | #332 | Tragic $33,921 |
| Immigrants | Yemen | 0.0 /100 | #333 | Tragic $33,696 |
| Natives/Alaskans | 0.0 /100 | #334 | Tragic $33,279 |
| Yuman | 0.0 /100 | #335 | Tragic $33,236 |
| Yakama | 0.0 /100 | #336 | Tragic $33,009 |
| Houma | 0.0 /100 | #337 | Tragic $32,996 |
| Arapaho | 0.0 /100 | #338 | Tragic $32,345 |
| Pueblo | 0.0 /100 | #339 | Tragic $32,012 |