Slovene vs Immigrants from Hong Kong Child Poverty Under the Age of 5
COMPARE
Slovene
Immigrants from Hong Kong
Child Poverty Under the Age of 5
Child Poverty Under the Age of 5 Comparison
Slovenes
Immigrants from Hong Kong
16.0%
CHILD POVERTY UNDER THE AGE OF 5
94.4/ 100
METRIC RATING
107th/ 347
METRIC RANK
12.4%
CHILD POVERTY UNDER THE AGE OF 5
100.0/ 100
METRIC RATING
5th/ 347
METRIC RANK
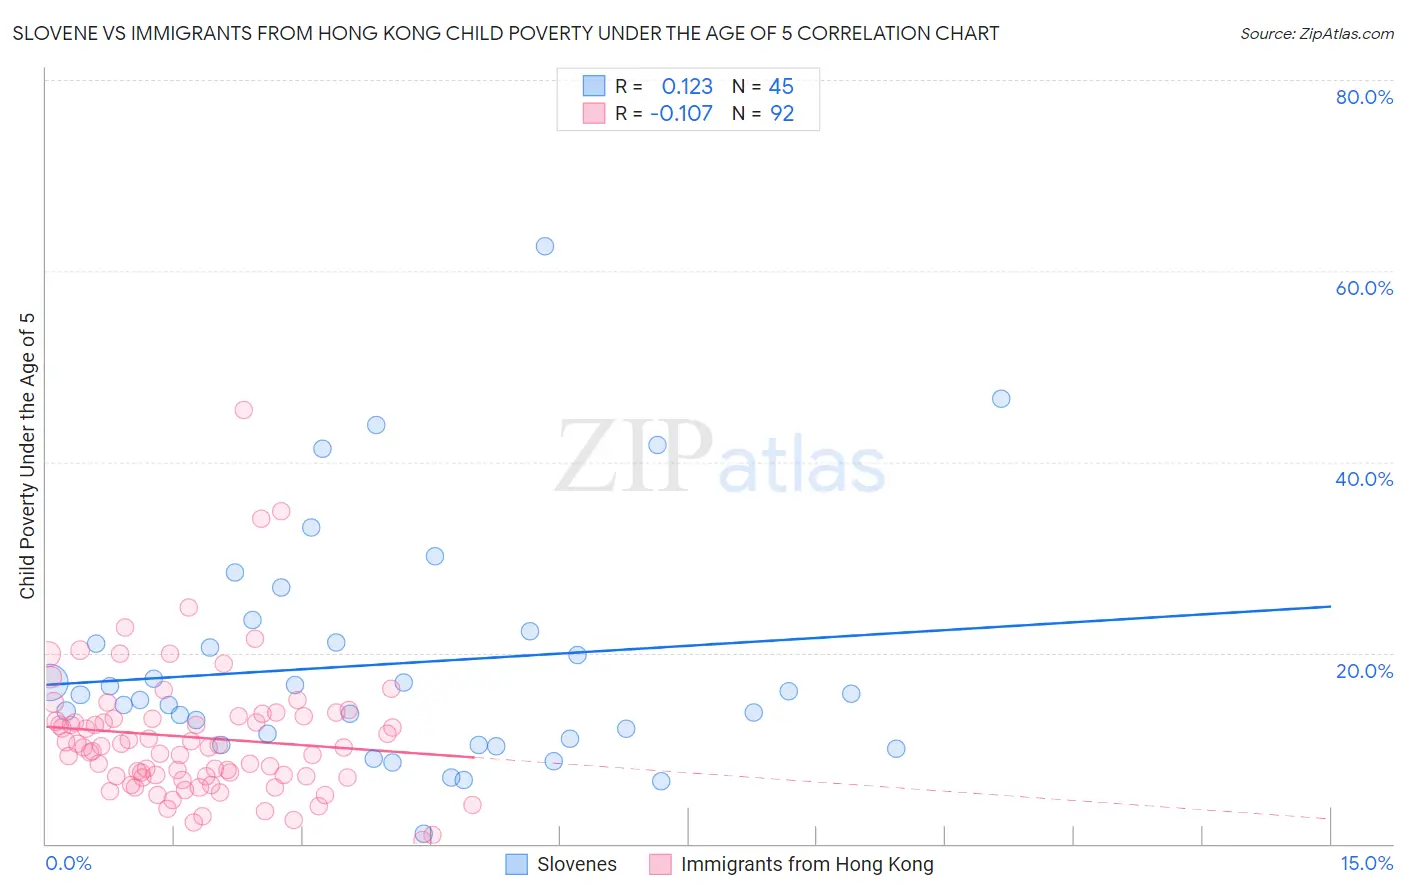
Slovene vs Immigrants from Hong Kong Child Poverty Under the Age of 5 Correlation Chart
The statistical analysis conducted on geographies consisting of 251,690,205 people shows a poor positive correlation between the proportion of Slovenes and poverty level among children under the age of 5 in the United States with a correlation coefficient (R) of 0.123 and weighted average of 16.0%. Similarly, the statistical analysis conducted on geographies consisting of 244,450,571 people shows a poor negative correlation between the proportion of Immigrants from Hong Kong and poverty level among children under the age of 5 in the United States with a correlation coefficient (R) of -0.107 and weighted average of 12.4%, a difference of 28.4%.
Child Poverty Under the Age of 5 Correlation Summary
| Measurement | Slovene | Immigrants from Hong Kong |
| Minimum | 1.0% | 0.42% |
| Maximum | 62.6% | 45.5% |
| Range | 61.6% | 45.0% |
| Mean | 18.9% | 11.1% |
| Median | 15.6% | 10.1% |
| Interquartile 25% (IQ1) | 10.7% | 7.0% |
| Interquartile 75% (IQ3) | 21.7% | 13.2% |
| Interquartile Range (IQR) | 11.0% | 6.2% |
| Standard Deviation (Sample) | 12.3% | 7.1% |
| Standard Deviation (Population) | 12.2% | 7.0% |
Similar Demographics by Child Poverty Under the Age of 5
Demographics Similar to Slovenes by Child Poverty Under the Age of 5
In terms of child poverty under the age of 5, the demographic groups most similar to Slovenes are Immigrants from Brazil (16.0%, a difference of 0.010%), Northern European (16.0%, a difference of 0.090%), Romanian (16.0%, a difference of 0.10%), Tlingit-Haida (15.9%, a difference of 0.14%), and Pakistani (16.0%, a difference of 0.14%).
| Demographics | Rating | Rank | Child Poverty Under the Age of 5 |
| Immigrants | Canada | 95.9 /100 | #100 | Exceptional 15.8% |
| Immigrants | Zimbabwe | 95.9 /100 | #101 | Exceptional 15.8% |
| Armenians | 95.7 /100 | #102 | Exceptional 15.8% |
| Europeans | 95.3 /100 | #103 | Exceptional 15.9% |
| Immigrants | North America | 94.9 /100 | #104 | Exceptional 15.9% |
| Immigrants | Spain | 94.8 /100 | #105 | Exceptional 15.9% |
| Tlingit-Haida | 94.7 /100 | #106 | Exceptional 15.9% |
| Slovenes | 94.4 /100 | #107 | Exceptional 16.0% |
| Immigrants | Brazil | 94.4 /100 | #108 | Exceptional 16.0% |
| Northern Europeans | 94.3 /100 | #109 | Exceptional 16.0% |
| Romanians | 94.3 /100 | #110 | Exceptional 16.0% |
| Pakistanis | 94.2 /100 | #111 | Exceptional 16.0% |
| Peruvians | 94.1 /100 | #112 | Exceptional 16.0% |
| Puget Sound Salish | 94.1 /100 | #113 | Exceptional 16.0% |
| Immigrants | Kuwait | 93.9 /100 | #114 | Exceptional 16.0% |
Demographics Similar to Immigrants from Hong Kong by Child Poverty Under the Age of 5
In terms of child poverty under the age of 5, the demographic groups most similar to Immigrants from Hong Kong are Thai (12.3%, a difference of 1.0%), Immigrants from Singapore (12.9%, a difference of 4.0%), Chinese (13.1%, a difference of 5.1%), Iranian (13.1%, a difference of 5.1%), and Immigrants from Iran (13.1%, a difference of 5.2%).
| Demographics | Rating | Rank | Child Poverty Under the Age of 5 |
| Immigrants | India | 100.0 /100 | #1 | Exceptional 11.5% |
| Immigrants | Taiwan | 100.0 /100 | #2 | Exceptional 11.6% |
| Filipinos | 100.0 /100 | #3 | Exceptional 11.6% |
| Thais | 100.0 /100 | #4 | Exceptional 12.3% |
| Immigrants | Hong Kong | 100.0 /100 | #5 | Exceptional 12.4% |
| Immigrants | Singapore | 100.0 /100 | #6 | Exceptional 12.9% |
| Chinese | 100.0 /100 | #7 | Exceptional 13.1% |
| Iranians | 100.0 /100 | #8 | Exceptional 13.1% |
| Immigrants | Iran | 100.0 /100 | #9 | Exceptional 13.1% |
| Burmese | 100.0 /100 | #10 | Exceptional 13.2% |
| Immigrants | Korea | 100.0 /100 | #11 | Exceptional 13.2% |
| Immigrants | South Central Asia | 100.0 /100 | #12 | Exceptional 13.3% |
| Bhutanese | 100.0 /100 | #13 | Exceptional 13.4% |
| Okinawans | 100.0 /100 | #14 | Exceptional 13.4% |
| Indians (Asian) | 100.0 /100 | #15 | Exceptional 13.4% |