Slavic vs Dutch West Indian Median Household Income
COMPARE
Slavic
Dutch West Indian
Median Household Income
Median Household Income Comparison
Slavs
Dutch West Indians
$86,398
MEDIAN HOUSEHOLD INCOME
69.7/ 100
METRIC RATING
161st/ 347
METRIC RANK
$68,412
MEDIAN HOUSEHOLD INCOME
0.0/ 100
METRIC RATING
329th/ 347
METRIC RANK
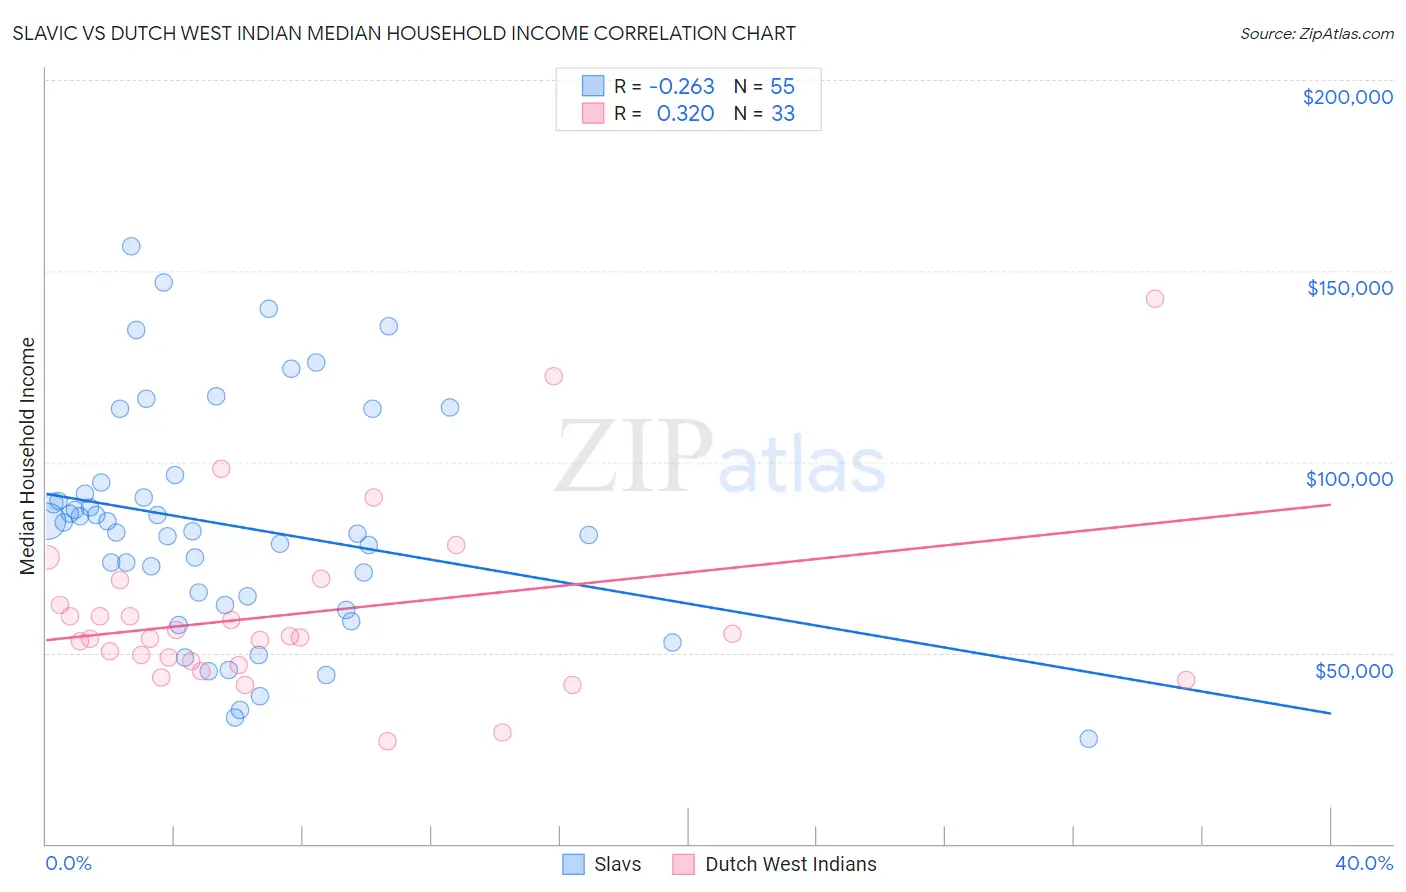
Slavic vs Dutch West Indian Median Household Income Correlation Chart
The statistical analysis conducted on geographies consisting of 270,777,755 people shows a weak negative correlation between the proportion of Slavs and median household income in the United States with a correlation coefficient (R) of -0.263 and weighted average of $86,398. Similarly, the statistical analysis conducted on geographies consisting of 85,760,396 people shows a mild positive correlation between the proportion of Dutch West Indians and median household income in the United States with a correlation coefficient (R) of 0.320 and weighted average of $68,412, a difference of 26.3%.
Median Household Income Correlation Summary
| Measurement | Slavic | Dutch West Indian |
| Minimum | $27,389 | $26,875 |
| Maximum | $156,479 | $142,750 |
| Range | $129,090 | $115,875 |
| Mean | $83,350 | $60,408 |
| Median | $81,875 | $53,986 |
| Interquartile 25% (IQ1) | $62,500 | $47,365 |
| Interquartile 75% (IQ3) | $94,752 | $65,865 |
| Interquartile Range (IQR) | $32,252 | $18,501 |
| Standard Deviation (Sample) | $29,906 | $23,943 |
| Standard Deviation (Population) | $29,633 | $23,577 |
Similar Demographics by Median Household Income
Demographics Similar to Slavs by Median Household Income
In terms of median household income, the demographic groups most similar to Slavs are Luxembourger ($86,418, a difference of 0.020%), Immigrants from Uzbekistan ($86,425, a difference of 0.030%), Moroccan ($86,468, a difference of 0.080%), Samoan ($86,498, a difference of 0.12%), and Immigrants from Albania ($86,534, a difference of 0.16%).
| Demographics | Rating | Rank | Median Household Income |
| Immigrants | Germany | 74.4 /100 | #154 | Good $86,764 |
| Carpatho Rusyns | 72.8 /100 | #155 | Good $86,635 |
| Immigrants | Albania | 71.5 /100 | #156 | Good $86,534 |
| Samoans | 71.0 /100 | #157 | Good $86,498 |
| Moroccans | 70.6 /100 | #158 | Good $86,468 |
| Immigrants | Uzbekistan | 70.1 /100 | #159 | Good $86,425 |
| Luxembourgers | 70.0 /100 | #160 | Good $86,418 |
| Slavs | 69.7 /100 | #161 | Good $86,398 |
| Guamanians/Chamorros | 67.7 /100 | #162 | Good $86,255 |
| Czechs | 66.4 /100 | #163 | Good $86,164 |
| Irish | 66.2 /100 | #164 | Good $86,145 |
| Norwegians | 65.3 /100 | #165 | Good $86,084 |
| Scandinavians | 65.1 /100 | #166 | Good $86,073 |
| Immigrants | Immigrants | 61.3 /100 | #167 | Good $85,818 |
| Icelanders | 61.0 /100 | #168 | Good $85,797 |
Demographics Similar to Dutch West Indians by Median Household Income
In terms of median household income, the demographic groups most similar to Dutch West Indians are Menominee ($68,423, a difference of 0.020%), Immigrants from Cuba ($68,461, a difference of 0.070%), Yuman ($68,743, a difference of 0.48%), Arapaho ($67,965, a difference of 0.66%), and Native/Alaskan ($67,879, a difference of 0.79%).
| Demographics | Rating | Rank | Median Household Income |
| Choctaw | 0.0 /100 | #322 | Tragic $69,947 |
| Bahamians | 0.0 /100 | #323 | Tragic $69,726 |
| Yup'ik | 0.0 /100 | #324 | Tragic $69,695 |
| Seminole | 0.0 /100 | #325 | Tragic $69,420 |
| Yuman | 0.0 /100 | #326 | Tragic $68,743 |
| Immigrants | Cuba | 0.0 /100 | #327 | Tragic $68,461 |
| Menominee | 0.0 /100 | #328 | Tragic $68,423 |
| Dutch West Indians | 0.0 /100 | #329 | Tragic $68,412 |
| Arapaho | 0.0 /100 | #330 | Tragic $67,965 |
| Natives/Alaskans | 0.0 /100 | #331 | Tragic $67,879 |
| Sioux | 0.0 /100 | #332 | Tragic $67,792 |
| Creek | 0.0 /100 | #333 | Tragic $67,715 |
| Blacks/African Americans | 0.0 /100 | #334 | Tragic $67,573 |
| Cheyenne | 0.0 /100 | #335 | Tragic $66,974 |
| Immigrants | Congo | 0.0 /100 | #336 | Tragic $66,768 |