Slavic vs Immigrants from Guyana Median Household Income
COMPARE
Slavic
Immigrants from Guyana
Median Household Income
Median Household Income Comparison
Slavs
Immigrants from Guyana
$86,398
MEDIAN HOUSEHOLD INCOME
69.7/ 100
METRIC RATING
161st/ 347
METRIC RANK
$80,324
MEDIAN HOUSEHOLD INCOME
4.5/ 100
METRIC RATING
235th/ 347
METRIC RANK
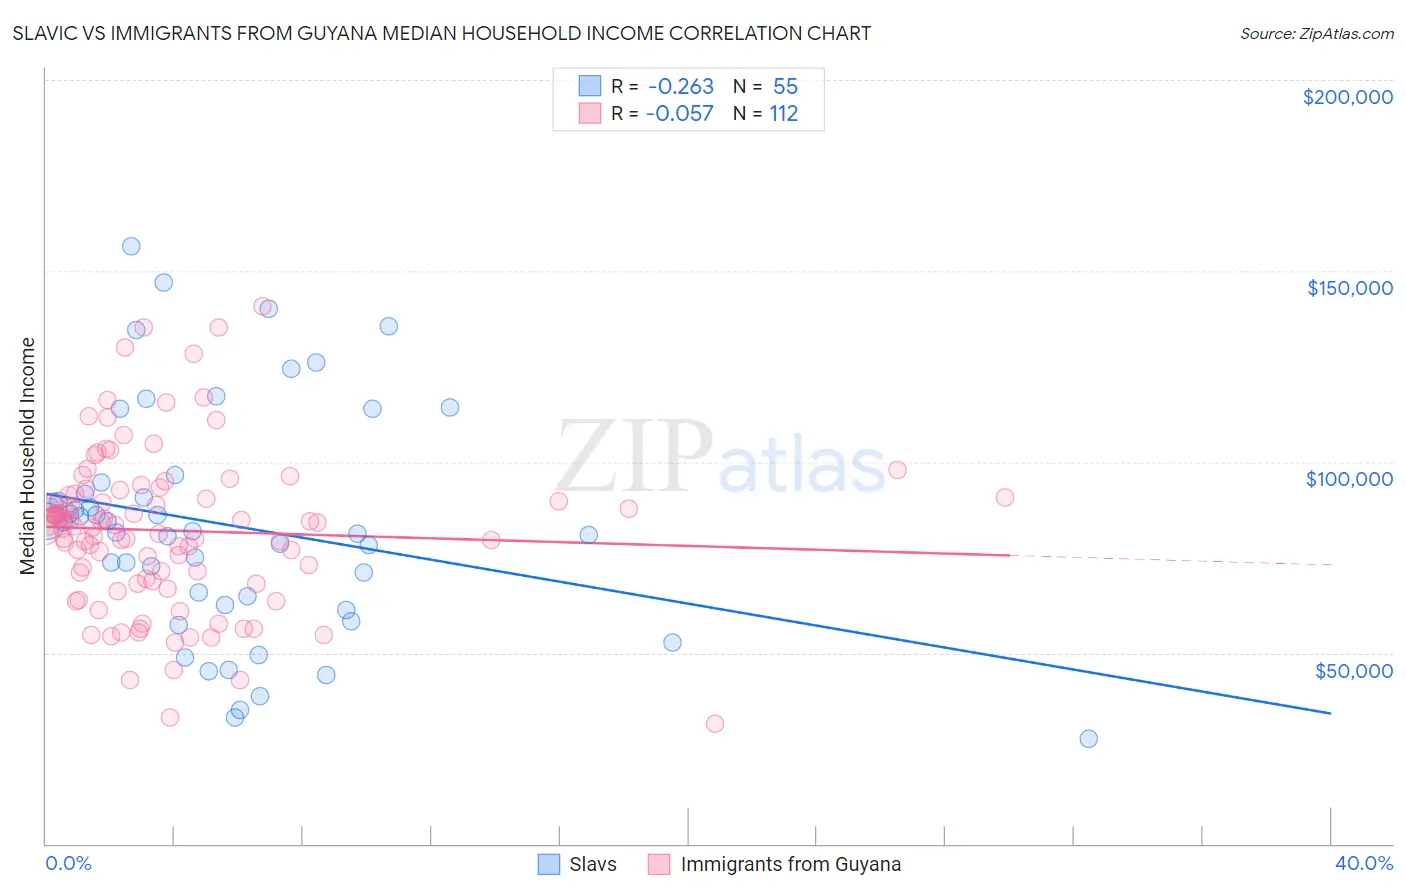
Slavic vs Immigrants from Guyana Median Household Income Correlation Chart
The statistical analysis conducted on geographies consisting of 270,777,755 people shows a weak negative correlation between the proportion of Slavs and median household income in the United States with a correlation coefficient (R) of -0.263 and weighted average of $86,398. Similarly, the statistical analysis conducted on geographies consisting of 183,660,864 people shows a slight negative correlation between the proportion of Immigrants from Guyana and median household income in the United States with a correlation coefficient (R) of -0.057 and weighted average of $80,324, a difference of 7.6%.
Median Household Income Correlation Summary
| Measurement | Slavic | Immigrants from Guyana |
| Minimum | $27,389 | $31,571 |
| Maximum | $156,479 | $140,893 |
| Range | $129,090 | $109,322 |
| Mean | $83,350 | $81,995 |
| Median | $81,875 | $83,283 |
| Interquartile 25% (IQ1) | $62,500 | $69,032 |
| Interquartile 75% (IQ3) | $94,752 | $91,451 |
| Interquartile Range (IQR) | $32,252 | $22,418 |
| Standard Deviation (Sample) | $29,906 | $20,739 |
| Standard Deviation (Population) | $29,633 | $20,646 |
Similar Demographics by Median Household Income
Demographics Similar to Slavs by Median Household Income
In terms of median household income, the demographic groups most similar to Slavs are Luxembourger ($86,418, a difference of 0.020%), Immigrants from Uzbekistan ($86,425, a difference of 0.030%), Moroccan ($86,468, a difference of 0.080%), Samoan ($86,498, a difference of 0.12%), and Immigrants from Albania ($86,534, a difference of 0.16%).
| Demographics | Rating | Rank | Median Household Income |
| Immigrants | Germany | 74.4 /100 | #154 | Good $86,764 |
| Carpatho Rusyns | 72.8 /100 | #155 | Good $86,635 |
| Immigrants | Albania | 71.5 /100 | #156 | Good $86,534 |
| Samoans | 71.0 /100 | #157 | Good $86,498 |
| Moroccans | 70.6 /100 | #158 | Good $86,468 |
| Immigrants | Uzbekistan | 70.1 /100 | #159 | Good $86,425 |
| Luxembourgers | 70.0 /100 | #160 | Good $86,418 |
| Slavs | 69.7 /100 | #161 | Good $86,398 |
| Guamanians/Chamorros | 67.7 /100 | #162 | Good $86,255 |
| Czechs | 66.4 /100 | #163 | Good $86,164 |
| Irish | 66.2 /100 | #164 | Good $86,145 |
| Norwegians | 65.3 /100 | #165 | Good $86,084 |
| Scandinavians | 65.1 /100 | #166 | Good $86,073 |
| Immigrants | Immigrants | 61.3 /100 | #167 | Good $85,818 |
| Icelanders | 61.0 /100 | #168 | Good $85,797 |
Demographics Similar to Immigrants from Guyana by Median Household Income
In terms of median household income, the demographic groups most similar to Immigrants from Guyana are Immigrants from Ecuador ($80,341, a difference of 0.020%), Immigrants from the Azores ($80,357, a difference of 0.040%), Immigrants from Trinidad and Tobago ($80,373, a difference of 0.060%), Bermudan ($80,406, a difference of 0.10%), and Trinidadian and Tobagonian ($80,402, a difference of 0.10%).
| Demographics | Rating | Rank | Median Household Income |
| Immigrants | Bangladesh | 5.7 /100 | #228 | Tragic $80,722 |
| Delaware | 5.0 /100 | #229 | Tragic $80,527 |
| Bermudans | 4.7 /100 | #230 | Tragic $80,406 |
| Trinidadians and Tobagonians | 4.7 /100 | #231 | Tragic $80,402 |
| Immigrants | Trinidad and Tobago | 4.6 /100 | #232 | Tragic $80,373 |
| Immigrants | Azores | 4.5 /100 | #233 | Tragic $80,357 |
| Immigrants | Ecuador | 4.5 /100 | #234 | Tragic $80,341 |
| Immigrants | Guyana | 4.5 /100 | #235 | Tragic $80,324 |
| Immigrants | Bosnia and Herzegovina | 3.4 /100 | #236 | Tragic $79,888 |
| Nicaraguans | 3.1 /100 | #237 | Tragic $79,737 |
| Barbadians | 3.0 /100 | #238 | Tragic $79,664 |
| Alaska Natives | 2.7 /100 | #239 | Tragic $79,509 |
| Immigrants | Western Africa | 2.7 /100 | #240 | Tragic $79,490 |
| Immigrants | Nonimmigrants | 2.6 /100 | #241 | Tragic $79,429 |
| Immigrants | Sudan | 2.1 /100 | #242 | Tragic $79,103 |