Immigrants from Russia vs Sierra Leonean Median Household Income
COMPARE
Immigrants from Russia
Sierra Leonean
Median Household Income
Median Household Income Comparison
Immigrants from Russia
Sierra Leoneans
$96,378
MEDIAN HOUSEHOLD INCOME
99.9/ 100
METRIC RATING
47th/ 347
METRIC RANK
$88,463
MEDIAN HOUSEHOLD INCOME
89.6/ 100
METRIC RATING
137th/ 347
METRIC RANK
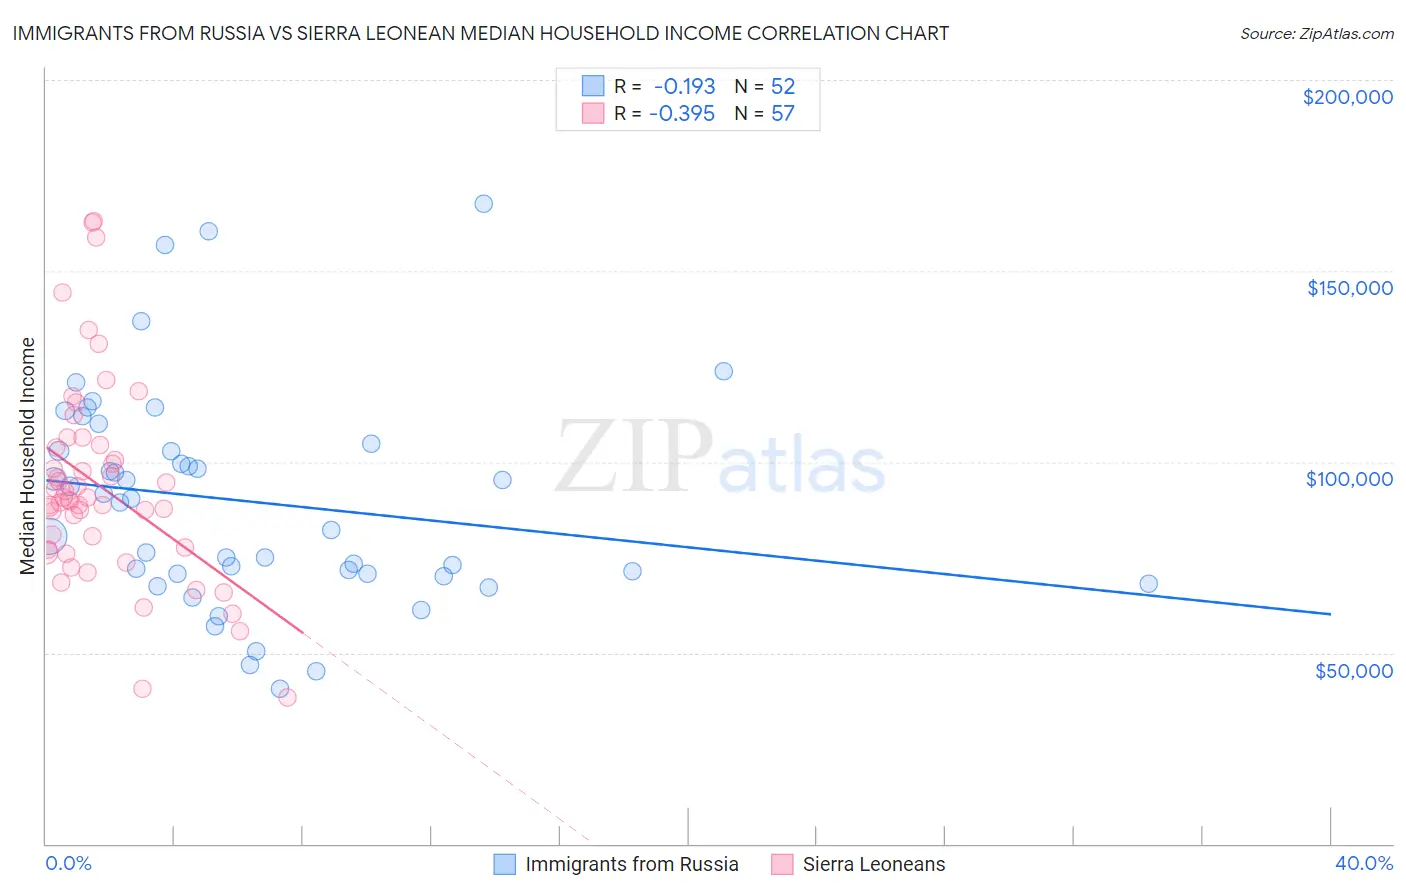
Immigrants from Russia vs Sierra Leonean Median Household Income Correlation Chart
The statistical analysis conducted on geographies consisting of 347,675,291 people shows a poor negative correlation between the proportion of Immigrants from Russia and median household income in the United States with a correlation coefficient (R) of -0.193 and weighted average of $96,378. Similarly, the statistical analysis conducted on geographies consisting of 83,336,605 people shows a mild negative correlation between the proportion of Sierra Leoneans and median household income in the United States with a correlation coefficient (R) of -0.395 and weighted average of $88,463, a difference of 8.9%.
Median Household Income Correlation Summary
| Measurement | Immigrants from Russia | Sierra Leonean |
| Minimum | $40,467 | $38,207 |
| Maximum | $167,656 | $162,895 |
| Range | $127,189 | $124,688 |
| Mean | $89,609 | $93,657 |
| Median | $89,857 | $89,856 |
| Interquartile 25% (IQ1) | $70,618 | $77,308 |
| Interquartile 75% (IQ3) | $103,868 | $103,980 |
| Interquartile Range (IQR) | $33,250 | $26,672 |
| Standard Deviation (Sample) | $28,243 | $25,946 |
| Standard Deviation (Population) | $27,970 | $25,718 |
Similar Demographics by Median Household Income
Demographics Similar to Immigrants from Russia by Median Household Income
In terms of median household income, the demographic groups most similar to Immigrants from Russia are Cambodian ($96,324, a difference of 0.060%), Immigrants from Malaysia ($96,292, a difference of 0.090%), Bulgarian ($96,290, a difference of 0.090%), Australian ($96,490, a difference of 0.12%), and Israeli ($96,552, a difference of 0.18%).
| Demographics | Rating | Rank | Median Household Income |
| Maltese | 100.0 /100 | #40 | Exceptional $97,015 |
| Immigrants | Turkey | 100.0 /100 | #41 | Exceptional $96,964 |
| Immigrants | Lithuania | 99.9 /100 | #42 | Exceptional $96,836 |
| Immigrants | France | 99.9 /100 | #43 | Exceptional $96,743 |
| Immigrants | Greece | 99.9 /100 | #44 | Exceptional $96,675 |
| Israelis | 99.9 /100 | #45 | Exceptional $96,552 |
| Australians | 99.9 /100 | #46 | Exceptional $96,490 |
| Immigrants | Russia | 99.9 /100 | #47 | Exceptional $96,378 |
| Cambodians | 99.9 /100 | #48 | Exceptional $96,324 |
| Immigrants | Malaysia | 99.9 /100 | #49 | Exceptional $96,292 |
| Bulgarians | 99.9 /100 | #50 | Exceptional $96,290 |
| Estonians | 99.9 /100 | #51 | Exceptional $95,930 |
| Immigrants | South Africa | 99.9 /100 | #52 | Exceptional $95,800 |
| Paraguayans | 99.9 /100 | #53 | Exceptional $95,737 |
| Egyptians | 99.9 /100 | #54 | Exceptional $95,673 |
Demographics Similar to Sierra Leoneans by Median Household Income
In terms of median household income, the demographic groups most similar to Sierra Leoneans are Polish ($88,472, a difference of 0.010%), Immigrants from Sierra Leone ($88,498, a difference of 0.040%), Swedish ($88,524, a difference of 0.070%), Arab ($88,398, a difference of 0.070%), and Immigrants from Chile ($88,388, a difference of 0.080%).
| Demographics | Rating | Rank | Median Household Income |
| British | 92.0 /100 | #130 | Exceptional $88,914 |
| Immigrants | Syria | 91.4 /100 | #131 | Exceptional $88,792 |
| Europeans | 91.2 /100 | #132 | Exceptional $88,751 |
| Immigrants | Ethiopia | 90.9 /100 | #133 | Exceptional $88,687 |
| Swedes | 90.0 /100 | #134 | Exceptional $88,524 |
| Immigrants | Sierra Leone | 89.9 /100 | #135 | Excellent $88,498 |
| Poles | 89.7 /100 | #136 | Excellent $88,472 |
| Sierra Leoneans | 89.6 /100 | #137 | Excellent $88,463 |
| Arabs | 89.2 /100 | #138 | Excellent $88,398 |
| Immigrants | Chile | 89.2 /100 | #139 | Excellent $88,388 |
| Lebanese | 87.2 /100 | #140 | Excellent $88,091 |
| Immigrants | Morocco | 86.0 /100 | #141 | Excellent $87,930 |
| Canadians | 84.7 /100 | #142 | Excellent $87,769 |
| Danes | 83.9 /100 | #143 | Excellent $87,676 |
| Serbians | 83.0 /100 | #144 | Excellent $87,572 |