Slavic vs Croatian Median Household Income

COMPARE

Slavic
Race
Ancestry
AfghanAfricanAlaska NativeAlaskan AthabascanAlbanianAleutAlsatianAmericanApacheArabArapahoArgentineanArmenianAssyrian/Chaldean/SyriacAustralianAustrianBahamianBangladeshiBarbadianBasqueBelgianBelizeanBermudanBhutaneseBlackfeetBolivianBrazilianBritishBritish West IndianBulgarianBurmeseCajunCambodianCanadianCape VerdeanCarpatho RusynCelticCentral AmericanCentral American IndianCherokeeCheyenneChickasawChileanChineseChippewaChoctawColombianColvilleComancheCosta RicanCreeCreekCrowCubanCypriotCzechCzechoslovakianDanishDelawareDominicanDutchDutch West IndianEastern EuropeanEcuadorianEgyptianEnglishEstonianEthiopianEuropeanFijianFilipinoFinnishFrenchFrench American IndianFrench CanadianGermanGerman RussianGhanaianGreekGuamanian/ChamorroGuatemalanGuyaneseHaitianHmongHonduranHopiHoumaHungarianIcelanderIndian (Asian)IndonesianInupiatIranianIraqiIrishIroquoisIsraeliItalianJamaicanJapaneseJordanianKenyanKiowaKoreanLaotianLatvianLebaneseLiberianLithuanianLumbeeLuxembourgerMacedonianMalaysianMalteseMarshalleseMenomineeMexicanMexican American IndianMongolianMoroccanNative HawaiianNavajoNepaleseNew ZealanderNicaraguanNigerianNorthern EuropeanNorwegianOkinawanOsageOttawaPaiutePakistaniPalestinianPanamanianParaguayanPennsylvania GermanPeruvianPimaPolishPortuguesePotawatomiPuebloPuerto RicanPuget Sound SalishRomanianRussianSalvadoranSamoanScandinavianScotch-IrishScottishSeminoleSenegaleseSerbianShoshoneSierra LeoneanSiouxSlavicSlovakSloveneSomaliSouth AfricanSouth AmericanSouth American IndianSoviet UnionSpaniardSpanishSpanish AmericanSpanish American IndianSri LankanSubsaharan AfricanSudaneseSwedishSwissSyrianTaiwaneseThaiTlingit-HaidaTohono O'OdhamTonganTrinidadian and TobagonianTsimshianTurkishU.S. Virgin IslanderUgandanUkrainianUruguayanUteVenezuelanVietnameseWelshWest IndianYakamaYaquiYugoslavianYumanYup'ikZimbabwean
Immigration
NonimmigrantsImmigrantsAfghanistanAfricaAlbaniaArgentinaArmeniaAsiaAustraliaAustriaBahamasBangladeshBarbadosBelarusBelgiumBelizeBoliviaBosnia and HerzegovinaBrazilBulgariaBurma/MyanmarCabo VerdeCambodiaCameroonCanadaCaribbeanCentral AmericaChileChinaColombiaCongoCosta RicaCroatiaCubaCzechoslovakiaDenmarkDominicaDominican RepublicEastern AfricaEastern AsiaEastern EuropeEcuadorEgyptEl SalvadorEnglandEritreaEthiopiaEuropeFijiFranceGermanyGhanaGreeceGrenadaGuatemalaGuyanaHaitiHondurasHong KongHungaryIndiaIndonesiaIranIraqIrelandIsraelItalyJamaicaJapanJordanKazakhstanKenyaKoreaKuwaitLaosLatin AmericaLatviaLebanonLiberiaLithuaniaMalaysiaMexicoMicronesiaMiddle AfricaMoldovaMoroccoNepalNetherlandsNicaraguaNigeriaNorth AmericaNorth MacedoniaNorthern AfricaNorthern EuropeNorwayOceaniaPakistanPanamaPeruPhilippinesPolandPortugalRomaniaRussiaSaudi ArabiaScotlandSenegalSerbiaSierra LeoneSingaporeSomaliaSouth AfricaSouth AmericaSouth Central AsiaSouth Eastern AsiaSouthern EuropeSpainSri LankaSt. Vincent and the GrenadinesSudanSwedenSwitzerlandSyriaTaiwanThailandTrinidad and TobagoTurkeyUgandaUkraineUruguayUzbekistanVenezuelaVietnamWest IndiesWestern AfricaWestern AsiaWestern EuropeYemenZaireZimbabweAzores
Croatian
Race
Ancestry
AfghanAfricanAlaska NativeAlaskan AthabascanAlbanianAleutAlsatianAmericanApacheArabArapahoArgentineanArmenianAssyrian/Chaldean/SyriacAustralianAustrianBahamianBangladeshiBarbadianBasqueBelgianBelizeanBermudanBhutaneseBlackfeetBolivianBrazilianBritishBritish West IndianBulgarianBurmeseCajunCambodianCanadianCape VerdeanCarpatho RusynCelticCentral AmericanCentral American IndianCherokeeCheyenneChickasawChileanChineseChippewaChoctawColombianColvilleComancheCosta RicanCreeCreekCroatianCrowCubanCypriotCzechCzechoslovakianDanishDelawareDominicanDutchDutch West IndianEastern EuropeanEcuadorianEgyptianEnglishEstonianEthiopianEuropeanFijianFilipinoFinnishFrenchFrench American IndianFrench CanadianGermanGerman RussianGhanaianGreekGuamanian/ChamorroGuatemalanGuyaneseHaitianHmongHonduranHopiHoumaHungarianIcelanderIndian (Asian)IndonesianInupiatIranianIraqiIrishIroquoisIsraeliItalianJamaicanJapaneseJordanianKenyanKiowaKoreanLaotianLatvianLebaneseLiberianLithuanianLumbeeLuxembourgerMacedonianMalaysianMalteseMarshalleseMenomineeMexicanMexican American IndianMongolianMoroccanNative HawaiianNavajoNepaleseNew ZealanderNicaraguanNigerianNorthern EuropeanNorwegianOkinawanOsageOttawaPaiutePakistaniPalestinianPanamanianParaguayanPennsylvania GermanPeruvianPimaPolishPortuguesePotawatomiPuebloPuerto RicanPuget Sound SalishRomanianRussianSalvadoranSamoanScandinavianScotch-IrishScottishSeminoleSenegaleseSerbianShoshoneSierra LeoneanSiouxSlovakSloveneSomaliSouth AfricanSouth AmericanSouth American IndianSoviet UnionSpaniardSpanishSpanish AmericanSpanish American IndianSri LankanSubsaharan AfricanSudaneseSwedishSwissSyrianTaiwaneseThaiTlingit-HaidaTohono O'OdhamTonganTrinidadian and TobagonianTsimshianTurkishU.S. Virgin IslanderUgandanUkrainianUruguayanUteVenezuelanVietnameseWelshWest IndianYakamaYaquiYugoslavianYumanYup'ikZimbabwean
Immigration
NonimmigrantsImmigrantsAfghanistanAfricaAlbaniaArgentinaArmeniaAsiaAustraliaAustriaBahamasBangladeshBarbadosBelarusBelgiumBelizeBoliviaBosnia and HerzegovinaBrazilBulgariaBurma/MyanmarCabo VerdeCambodiaCameroonCanadaCaribbeanCentral AmericaChileChinaColombiaCongoCosta RicaCroatiaCubaCzechoslovakiaDenmarkDominicaDominican RepublicEastern AfricaEastern AsiaEastern EuropeEcuadorEgyptEl SalvadorEnglandEritreaEthiopiaEuropeFijiFranceGermanyGhanaGreeceGrenadaGuatemalaGuyanaHaitiHondurasHong KongHungaryIndiaIndonesiaIranIraqIrelandIsraelItalyJamaicaJapanJordanKazakhstanKenyaKoreaKuwaitLaosLatin AmericaLatviaLebanonLiberiaLithuaniaMalaysiaMexicoMicronesiaMiddle AfricaMoldovaMoroccoNepalNetherlandsNicaraguaNigeriaNorth AmericaNorth MacedoniaNorthern AfricaNorthern EuropeNorwayOceaniaPakistanPanamaPeruPhilippinesPolandPortugalRomaniaRussiaSaudi ArabiaScotlandSenegalSerbiaSierra LeoneSingaporeSomaliaSouth AfricaSouth AmericaSouth Central AsiaSouth Eastern AsiaSouthern EuropeSpainSri LankaSt. Vincent and the GrenadinesSudanSwedenSwitzerlandSyriaTaiwanThailandTrinidad and TobagoTurkeyUgandaUkraineUruguayUzbekistanVenezuelaVietnamWest IndiesWestern AfricaWestern AsiaWestern EuropeYemenZaireZimbabweAzores
Median Household Income
Income
Poverty
Unemployment
Labor Participation
Family Structure
Vehicle Availability
Education Level
Disability

Median Household Income Comparison

Slavs

Croatians

Good
Exceptional
$86,398
MEDIAN HOUSEHOLD INCOME
69.7/ 100
METRIC RATING
161st/ 347
METRIC RANK
$90,685
MEDIAN HOUSEHOLD INCOME
97.3/ 100
METRIC RATING
107th/ 347
METRIC RANK

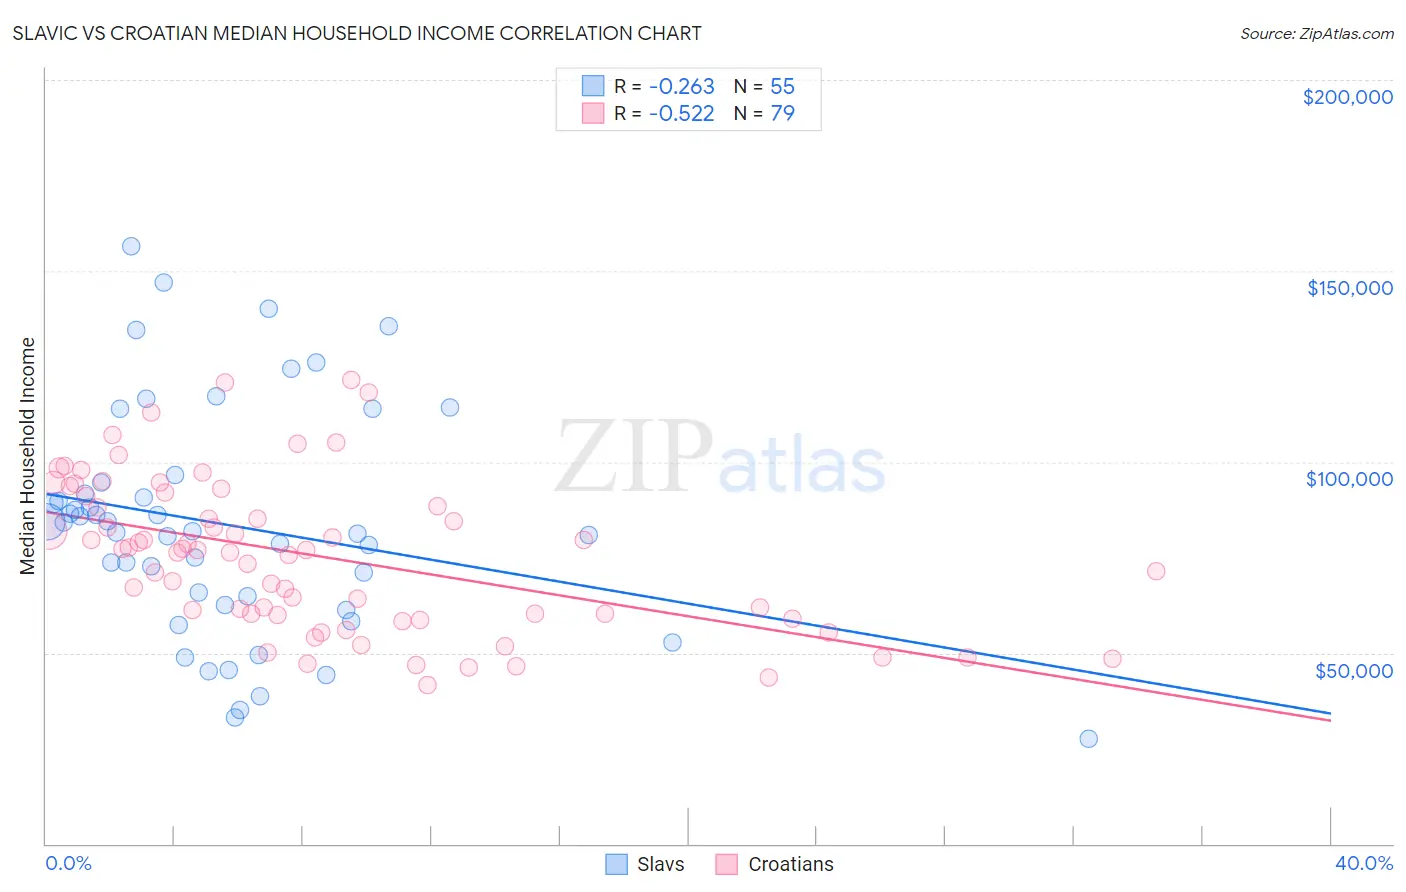
Slavic vs Croatian Median Household Income Correlation Chart

The statistical analysis conducted on geographies consisting of 270,777,755 people shows a weak negative correlation between the proportion of Slavs and median household income in the United States with a correlation coefficient (R) of -0.263 and weighted average of $86,398. Similarly, the statistical analysis conducted on geographies consisting of 375,471,157 people shows a substantial negative correlation between the proportion of Croatians and median household income in the United States with a correlation coefficient (R) of -0.522 and weighted average of $90,685, a difference of 5.0%.
Slavic vs Croatian Median Household Income

Median Household Income Correlation Summary

MeasurementSlavicCroatian
Minimum$27,389$41,696
Maximum$156,479$121,425
Range$129,090$79,729
Mean$83,350$75,345
Median$81,875$76,836
Interquartile 25% (IQ1)$62,500$59,949
Interquartile 75% (IQ3)$94,752$91,012
Interquartile Range (IQR)$32,252$31,063
Standard Deviation (Sample)$29,906$19,789
Standard Deviation (Population)$29,633$19,663

Similar Demographics by Median Household Income

Demographics Similar to Slavs by Median Household Income

In terms of median household income, the demographic groups most similar to Slavs are Luxembourger ($86,418, a difference of 0.020%), Immigrants from Uzbekistan ($86,425, a difference of 0.030%), Moroccan ($86,468, a difference of 0.080%), Samoan ($86,498, a difference of 0.12%), and Immigrants from Albania ($86,534, a difference of 0.16%).
DemographicsRating | RankMedian Household Income
Immigrants | Germany
74.4
/100
|
#154
Good
$86,764
Carpatho Rusyns
72.8
/100
|
#155
Good
$86,635
Immigrants | Albania
71.5
/100
|
#156
Good
$86,534
Samoans
71.0
/100
|
#157
Good
$86,498
Moroccans
70.6
/100
|
#158
Good
$86,468
Immigrants | Uzbekistan
70.1
/100
|
#159
Good
$86,425
Luxembourgers
70.0
/100
|
#160
Good
$86,418
Slavs
69.7
/100
|
#161
Good
$86,398
Guamanians/Chamorros
67.7
/100
|
#162
Good
$86,255
Czechs
66.4
/100
|
#163
Good
$86,164
Irish
66.2
/100
|
#164
Good
$86,145
Norwegians
65.3
/100
|
#165
Good
$86,084
Scandinavians
65.1
/100
|
#166
Good
$86,073
Immigrants | Immigrants
61.3
/100
|
#167
Good
$85,818
Icelanders
61.0
/100
|
#168
Good
$85,797

Demographics Similar to Croatians by Median Household Income

In terms of median household income, the demographic groups most similar to Croatians are Zimbabwean ($90,618, a difference of 0.070%), Macedonian ($90,761, a difference of 0.080%), Chilean ($90,605, a difference of 0.090%), Palestinian ($90,574, a difference of 0.12%), and Immigrants from Poland ($90,549, a difference of 0.15%).
DemographicsRating | RankMedian Household Income
Ukrainians
98.3
/100
|
#100
Exceptional
$91,456
Immigrants | Moldova
98.3
/100
|
#101
Exceptional
$91,446
Austrians
98.2
/100
|
#102
Exceptional
$91,339
Immigrants | Ukraine
98.0
/100
|
#103
Exceptional
$91,124
Immigrants | Kazakhstan
97.8
/100
|
#104
Exceptional
$91,015
Immigrants | Brazil
97.7
/100
|
#105
Exceptional
$90,907
Macedonians
97.4
/100
|
#106
Exceptional
$90,761
Croatians
97.3
/100
|
#107
Exceptional
$90,685
Zimbabweans
97.2
/100
|
#108
Exceptional
$90,618
Chileans
97.2
/100
|
#109
Exceptional
$90,605
Palestinians
97.1
/100
|
#110
Exceptional
$90,574
Immigrants | Poland
97.1
/100
|
#111
Exceptional
$90,549
Northern Europeans
96.9
/100
|
#112
Exceptional
$90,446
Peruvians
96.5
/100
|
#113
Exceptional
$90,261
Immigrants | Northern Africa
95.9
/100
|
#114
Exceptional
$90,026