Slavic vs Apache Median Household Income
COMPARE
Slavic
Apache
Median Household Income
Median Household Income Comparison
Slavs
Apache
$86,398
MEDIAN HOUSEHOLD INCOME
69.7/ 100
METRIC RATING
161st/ 347
METRIC RANK
$70,927
MEDIAN HOUSEHOLD INCOME
0.0/ 100
METRIC RATING
316th/ 347
METRIC RANK
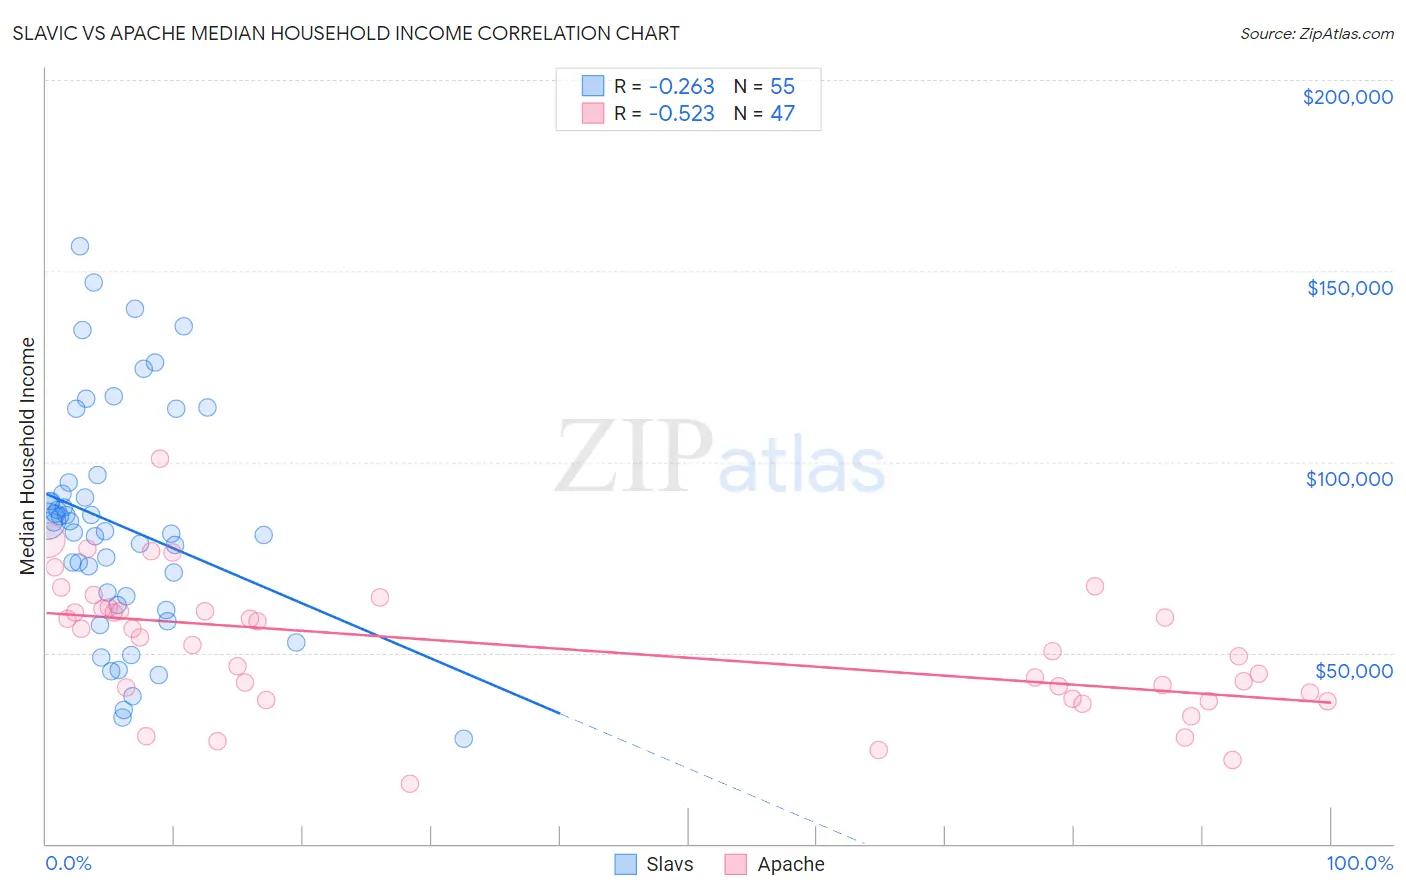
Slavic vs Apache Median Household Income Correlation Chart
The statistical analysis conducted on geographies consisting of 270,777,755 people shows a weak negative correlation between the proportion of Slavs and median household income in the United States with a correlation coefficient (R) of -0.263 and weighted average of $86,398. Similarly, the statistical analysis conducted on geographies consisting of 230,997,736 people shows a substantial negative correlation between the proportion of Apache and median household income in the United States with a correlation coefficient (R) of -0.523 and weighted average of $70,927, a difference of 21.8%.
Median Household Income Correlation Summary
| Measurement | Slavic | Apache |
| Minimum | $27,389 | $15,577 |
| Maximum | $156,479 | $100,781 |
| Range | $129,090 | $85,204 |
| Mean | $83,350 | $51,361 |
| Median | $81,875 | $52,202 |
| Interquartile 25% (IQ1) | $62,500 | $38,125 |
| Interquartile 75% (IQ3) | $94,752 | $61,561 |
| Interquartile Range (IQR) | $32,252 | $23,436 |
| Standard Deviation (Sample) | $29,906 | $17,390 |
| Standard Deviation (Population) | $29,633 | $17,204 |
Similar Demographics by Median Household Income
Demographics Similar to Slavs by Median Household Income
In terms of median household income, the demographic groups most similar to Slavs are Luxembourger ($86,418, a difference of 0.020%), Immigrants from Uzbekistan ($86,425, a difference of 0.030%), Moroccan ($86,468, a difference of 0.080%), Samoan ($86,498, a difference of 0.12%), and Immigrants from Albania ($86,534, a difference of 0.16%).
| Demographics | Rating | Rank | Median Household Income |
| Immigrants | Germany | 74.4 /100 | #154 | Good $86,764 |
| Carpatho Rusyns | 72.8 /100 | #155 | Good $86,635 |
| Immigrants | Albania | 71.5 /100 | #156 | Good $86,534 |
| Samoans | 71.0 /100 | #157 | Good $86,498 |
| Moroccans | 70.6 /100 | #158 | Good $86,468 |
| Immigrants | Uzbekistan | 70.1 /100 | #159 | Good $86,425 |
| Luxembourgers | 70.0 /100 | #160 | Good $86,418 |
| Slavs | 69.7 /100 | #161 | Good $86,398 |
| Guamanians/Chamorros | 67.7 /100 | #162 | Good $86,255 |
| Czechs | 66.4 /100 | #163 | Good $86,164 |
| Irish | 66.2 /100 | #164 | Good $86,145 |
| Norwegians | 65.3 /100 | #165 | Good $86,084 |
| Scandinavians | 65.1 /100 | #166 | Good $86,073 |
| Immigrants | Immigrants | 61.3 /100 | #167 | Good $85,818 |
| Icelanders | 61.0 /100 | #168 | Good $85,797 |
Demographics Similar to Apache by Median Household Income
In terms of median household income, the demographic groups most similar to Apache are Ottawa ($70,984, a difference of 0.080%), Cajun ($70,605, a difference of 0.46%), Dominican ($71,302, a difference of 0.53%), Chippewa ($70,539, a difference of 0.55%), and Immigrants from Bahamas ($71,349, a difference of 0.59%).
| Demographics | Rating | Rank | Median Household Income |
| Immigrants | Caribbean | 0.0 /100 | #309 | Tragic $71,860 |
| U.S. Virgin Islanders | 0.0 /100 | #310 | Tragic $71,853 |
| Immigrants | Zaire | 0.0 /100 | #311 | Tragic $71,801 |
| Immigrants | Honduras | 0.0 /100 | #312 | Tragic $71,452 |
| Immigrants | Bahamas | 0.0 /100 | #313 | Tragic $71,349 |
| Dominicans | 0.0 /100 | #314 | Tragic $71,302 |
| Ottawa | 0.0 /100 | #315 | Tragic $70,984 |
| Apache | 0.0 /100 | #316 | Tragic $70,927 |
| Cajuns | 0.0 /100 | #317 | Tragic $70,605 |
| Chippewa | 0.0 /100 | #318 | Tragic $70,539 |
| Immigrants | Dominican Republic | 0.0 /100 | #319 | Tragic $70,208 |
| Colville | 0.0 /100 | #320 | Tragic $70,094 |
| Chickasaw | 0.0 /100 | #321 | Tragic $70,005 |
| Choctaw | 0.0 /100 | #322 | Tragic $69,947 |
| Bahamians | 0.0 /100 | #323 | Tragic $69,726 |