Immigrants from Belize vs Sierra Leonean Median Household Income
COMPARE
Immigrants from Belize
Sierra Leonean
Median Household Income
Median Household Income Comparison
Immigrants from Belize
Sierra Leoneans
$75,938
MEDIAN HOUSEHOLD INCOME
0.3/ 100
METRIC RATING
265th/ 347
METRIC RANK
$88,463
MEDIAN HOUSEHOLD INCOME
89.6/ 100
METRIC RATING
137th/ 347
METRIC RANK
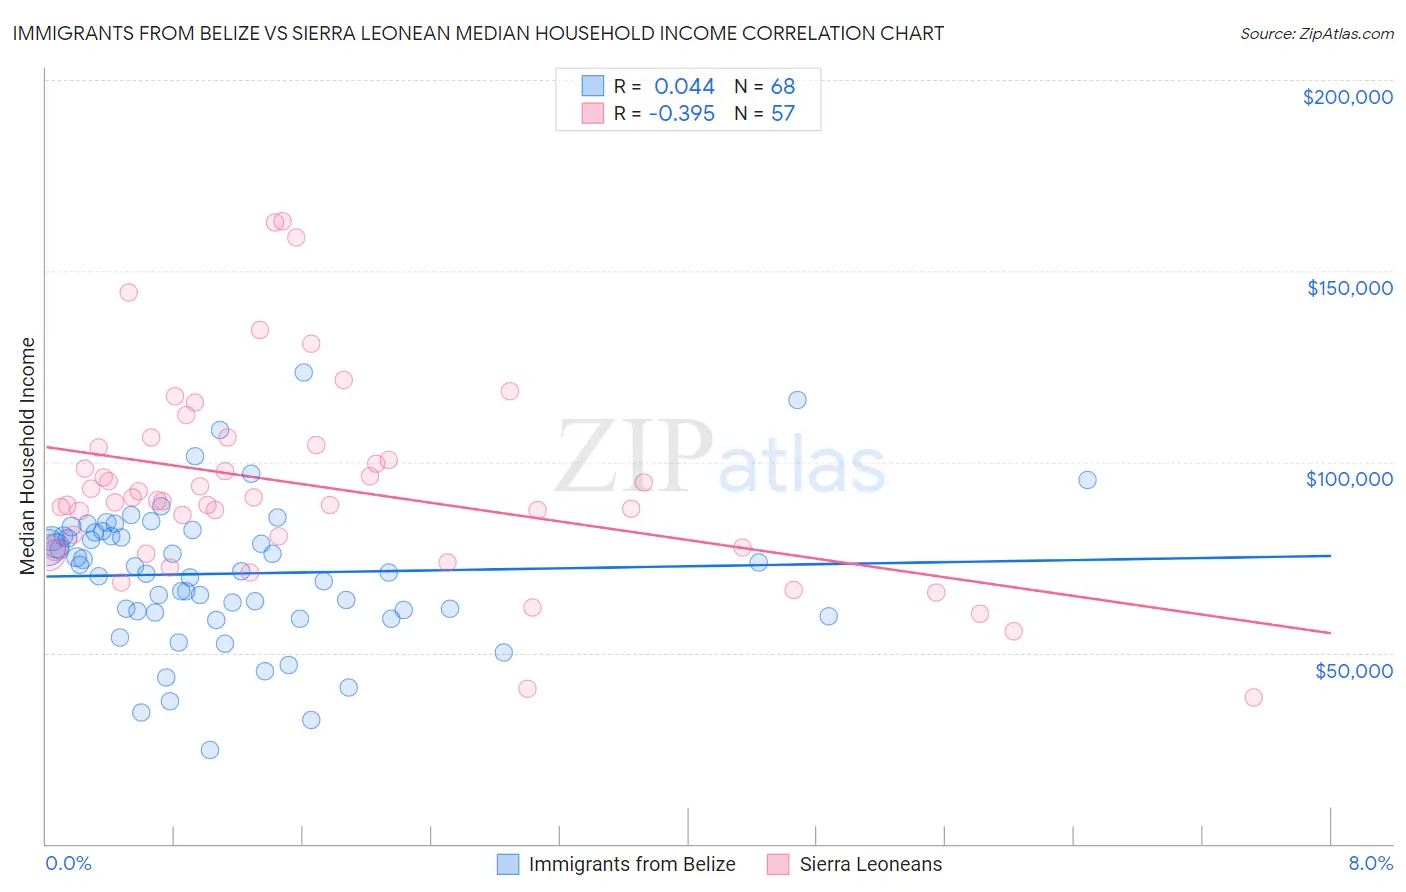
Immigrants from Belize vs Sierra Leonean Median Household Income Correlation Chart
The statistical analysis conducted on geographies consisting of 130,279,222 people shows no correlation between the proportion of Immigrants from Belize and median household income in the United States with a correlation coefficient (R) of 0.044 and weighted average of $75,938. Similarly, the statistical analysis conducted on geographies consisting of 83,336,605 people shows a mild negative correlation between the proportion of Sierra Leoneans and median household income in the United States with a correlation coefficient (R) of -0.395 and weighted average of $88,463, a difference of 16.5%.
Median Household Income Correlation Summary
| Measurement | Immigrants from Belize | Sierra Leonean |
| Minimum | $24,491 | $38,207 |
| Maximum | $123,457 | $162,895 |
| Range | $98,966 | $124,688 |
| Mean | $70,734 | $93,657 |
| Median | $72,073 | $89,856 |
| Interquartile 25% (IQ1) | $60,781 | $77,308 |
| Interquartile 75% (IQ3) | $80,909 | $103,980 |
| Interquartile Range (IQR) | $20,129 | $26,672 |
| Standard Deviation (Sample) | $18,493 | $25,946 |
| Standard Deviation (Population) | $18,357 | $25,718 |
Similar Demographics by Median Household Income
Demographics Similar to Immigrants from Belize by Median Household Income
In terms of median household income, the demographic groups most similar to Immigrants from Belize are American ($75,932, a difference of 0.010%), Guatemalan ($75,961, a difference of 0.030%), German Russian ($75,856, a difference of 0.11%), Immigrants from Jamaica ($75,851, a difference of 0.11%), and Cape Verdean ($75,848, a difference of 0.12%).
| Demographics | Rating | Rank | Median Household Income |
| Immigrants | Nicaragua | 0.5 /100 | #258 | Tragic $76,784 |
| Spanish American Indians | 0.4 /100 | #259 | Tragic $76,670 |
| Jamaicans | 0.4 /100 | #260 | Tragic $76,583 |
| Immigrants | Grenada | 0.4 /100 | #261 | Tragic $76,517 |
| French American Indians | 0.4 /100 | #262 | Tragic $76,387 |
| Alaskan Athabascans | 0.4 /100 | #263 | Tragic $76,383 |
| Guatemalans | 0.3 /100 | #264 | Tragic $75,961 |
| Immigrants | Belize | 0.3 /100 | #265 | Tragic $75,938 |
| Americans | 0.3 /100 | #266 | Tragic $75,932 |
| German Russians | 0.3 /100 | #267 | Tragic $75,856 |
| Immigrants | Jamaica | 0.3 /100 | #268 | Tragic $75,851 |
| Cape Verdeans | 0.3 /100 | #269 | Tragic $75,848 |
| Hmong | 0.3 /100 | #270 | Tragic $75,839 |
| Pennsylvania Germans | 0.3 /100 | #271 | Tragic $75,814 |
| Somalis | 0.3 /100 | #272 | Tragic $75,782 |
Demographics Similar to Sierra Leoneans by Median Household Income
In terms of median household income, the demographic groups most similar to Sierra Leoneans are Polish ($88,472, a difference of 0.010%), Immigrants from Sierra Leone ($88,498, a difference of 0.040%), Swedish ($88,524, a difference of 0.070%), Arab ($88,398, a difference of 0.070%), and Immigrants from Chile ($88,388, a difference of 0.080%).
| Demographics | Rating | Rank | Median Household Income |
| British | 92.0 /100 | #130 | Exceptional $88,914 |
| Immigrants | Syria | 91.4 /100 | #131 | Exceptional $88,792 |
| Europeans | 91.2 /100 | #132 | Exceptional $88,751 |
| Immigrants | Ethiopia | 90.9 /100 | #133 | Exceptional $88,687 |
| Swedes | 90.0 /100 | #134 | Exceptional $88,524 |
| Immigrants | Sierra Leone | 89.9 /100 | #135 | Excellent $88,498 |
| Poles | 89.7 /100 | #136 | Excellent $88,472 |
| Sierra Leoneans | 89.6 /100 | #137 | Excellent $88,463 |
| Arabs | 89.2 /100 | #138 | Excellent $88,398 |
| Immigrants | Chile | 89.2 /100 | #139 | Excellent $88,388 |
| Lebanese | 87.2 /100 | #140 | Excellent $88,091 |
| Immigrants | Morocco | 86.0 /100 | #141 | Excellent $87,930 |
| Canadians | 84.7 /100 | #142 | Excellent $87,769 |
| Danes | 83.9 /100 | #143 | Excellent $87,676 |
| Serbians | 83.0 /100 | #144 | Excellent $87,572 |