Yup'ik vs Sierra Leonean Median Household Income
COMPARE
Yup'ik
Sierra Leonean
Median Household Income
Median Household Income Comparison
Yup'ik
Sierra Leoneans
$69,695
MEDIAN HOUSEHOLD INCOME
0.0/ 100
METRIC RATING
324th/ 347
METRIC RANK
$88,463
MEDIAN HOUSEHOLD INCOME
89.6/ 100
METRIC RATING
137th/ 347
METRIC RANK
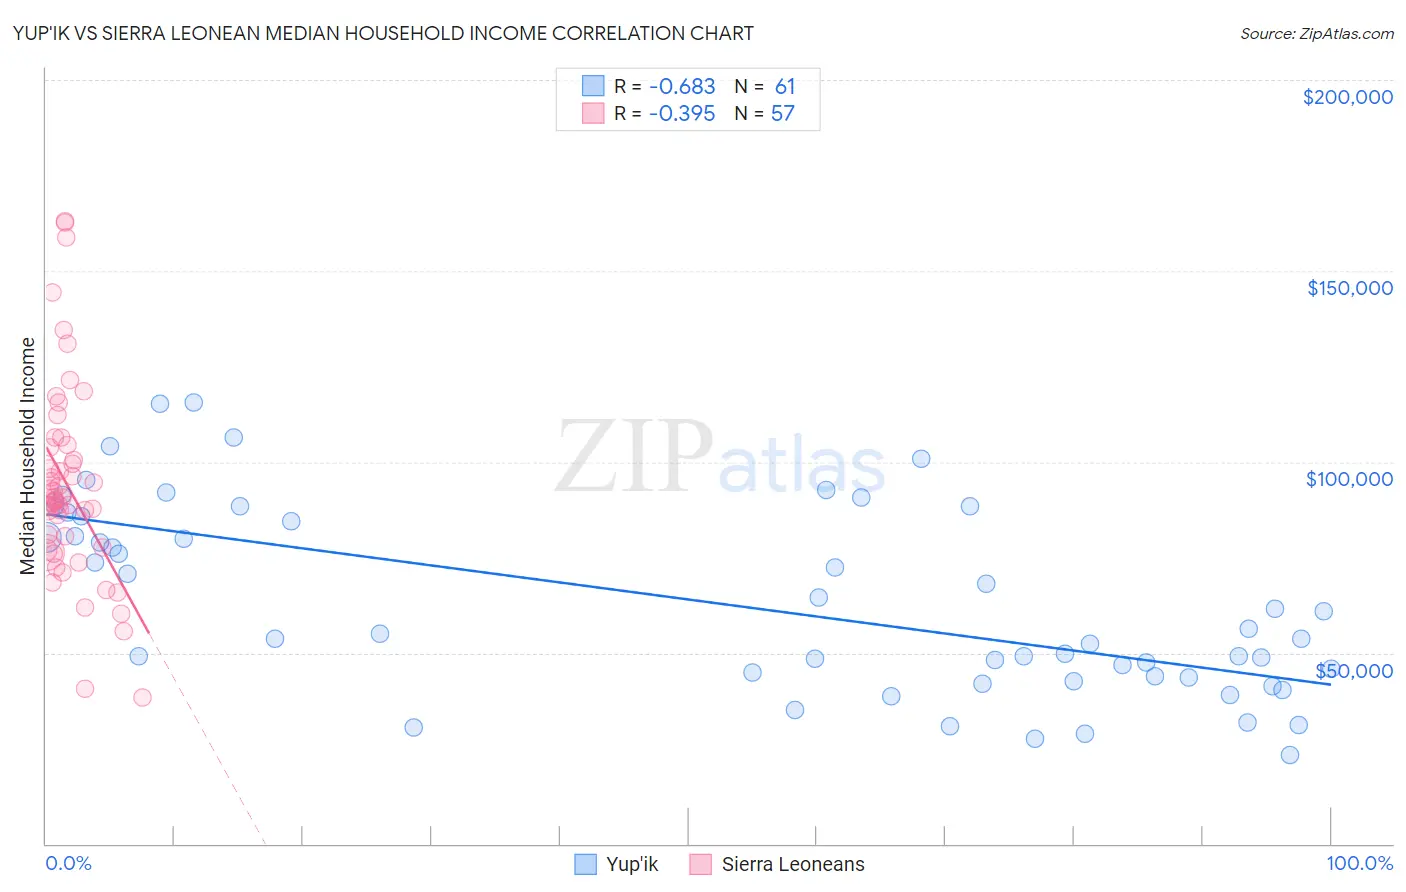
Yup'ik vs Sierra Leonean Median Household Income Correlation Chart
The statistical analysis conducted on geographies consisting of 39,952,449 people shows a significant negative correlation between the proportion of Yup'ik and median household income in the United States with a correlation coefficient (R) of -0.683 and weighted average of $69,695. Similarly, the statistical analysis conducted on geographies consisting of 83,336,605 people shows a mild negative correlation between the proportion of Sierra Leoneans and median household income in the United States with a correlation coefficient (R) of -0.395 and weighted average of $88,463, a difference of 26.9%.
Median Household Income Correlation Summary
| Measurement | Yup'ik | Sierra Leonean |
| Minimum | $23,333 | $38,207 |
| Maximum | $115,625 | $162,895 |
| Range | $92,292 | $124,688 |
| Mean | $62,948 | $93,657 |
| Median | $55,000 | $89,856 |
| Interquartile 25% (IQ1) | $43,673 | $77,308 |
| Interquartile 75% (IQ3) | $85,198 | $103,980 |
| Interquartile Range (IQR) | $41,525 | $26,672 |
| Standard Deviation (Sample) | $24,365 | $25,946 |
| Standard Deviation (Population) | $24,165 | $25,718 |
Similar Demographics by Median Household Income
Demographics Similar to Yup'ik by Median Household Income
In terms of median household income, the demographic groups most similar to Yup'ik are Bahamian ($69,726, a difference of 0.040%), Choctaw ($69,947, a difference of 0.36%), Seminole ($69,420, a difference of 0.40%), Chickasaw ($70,005, a difference of 0.45%), and Colville ($70,094, a difference of 0.57%).
| Demographics | Rating | Rank | Median Household Income |
| Cajuns | 0.0 /100 | #317 | Tragic $70,605 |
| Chippewa | 0.0 /100 | #318 | Tragic $70,539 |
| Immigrants | Dominican Republic | 0.0 /100 | #319 | Tragic $70,208 |
| Colville | 0.0 /100 | #320 | Tragic $70,094 |
| Chickasaw | 0.0 /100 | #321 | Tragic $70,005 |
| Choctaw | 0.0 /100 | #322 | Tragic $69,947 |
| Bahamians | 0.0 /100 | #323 | Tragic $69,726 |
| Yup'ik | 0.0 /100 | #324 | Tragic $69,695 |
| Seminole | 0.0 /100 | #325 | Tragic $69,420 |
| Yuman | 0.0 /100 | #326 | Tragic $68,743 |
| Immigrants | Cuba | 0.0 /100 | #327 | Tragic $68,461 |
| Menominee | 0.0 /100 | #328 | Tragic $68,423 |
| Dutch West Indians | 0.0 /100 | #329 | Tragic $68,412 |
| Arapaho | 0.0 /100 | #330 | Tragic $67,965 |
| Natives/Alaskans | 0.0 /100 | #331 | Tragic $67,879 |
Demographics Similar to Sierra Leoneans by Median Household Income
In terms of median household income, the demographic groups most similar to Sierra Leoneans are Polish ($88,472, a difference of 0.010%), Immigrants from Sierra Leone ($88,498, a difference of 0.040%), Swedish ($88,524, a difference of 0.070%), Arab ($88,398, a difference of 0.070%), and Immigrants from Chile ($88,388, a difference of 0.080%).
| Demographics | Rating | Rank | Median Household Income |
| British | 92.0 /100 | #130 | Exceptional $88,914 |
| Immigrants | Syria | 91.4 /100 | #131 | Exceptional $88,792 |
| Europeans | 91.2 /100 | #132 | Exceptional $88,751 |
| Immigrants | Ethiopia | 90.9 /100 | #133 | Exceptional $88,687 |
| Swedes | 90.0 /100 | #134 | Exceptional $88,524 |
| Immigrants | Sierra Leone | 89.9 /100 | #135 | Excellent $88,498 |
| Poles | 89.7 /100 | #136 | Excellent $88,472 |
| Sierra Leoneans | 89.6 /100 | #137 | Excellent $88,463 |
| Arabs | 89.2 /100 | #138 | Excellent $88,398 |
| Immigrants | Chile | 89.2 /100 | #139 | Excellent $88,388 |
| Lebanese | 87.2 /100 | #140 | Excellent $88,091 |
| Immigrants | Morocco | 86.0 /100 | #141 | Excellent $87,930 |
| Canadians | 84.7 /100 | #142 | Excellent $87,769 |
| Danes | 83.9 /100 | #143 | Excellent $87,676 |
| Serbians | 83.0 /100 | #144 | Excellent $87,572 |