Slavic vs Immigrants from Armenia Median Household Income
COMPARE
Slavic
Immigrants from Armenia
Median Household Income
Median Household Income Comparison
Slavs
Immigrants from Armenia
$86,398
MEDIAN HOUSEHOLD INCOME
69.7/ 100
METRIC RATING
161st/ 347
METRIC RANK
$83,555
MEDIAN HOUSEHOLD INCOME
27.0/ 100
METRIC RATING
195th/ 347
METRIC RANK
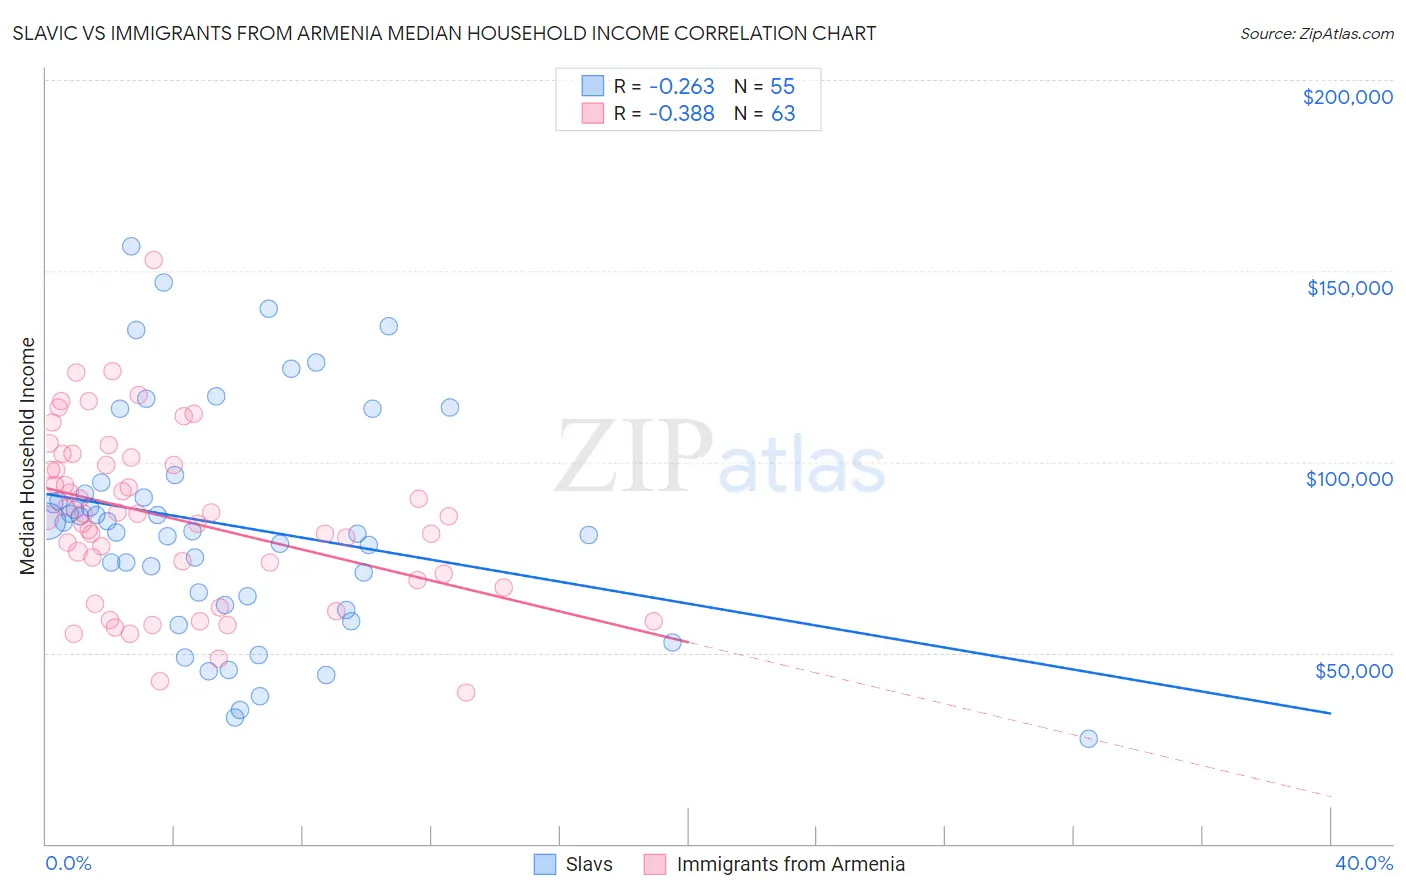
Slavic vs Immigrants from Armenia Median Household Income Correlation Chart
The statistical analysis conducted on geographies consisting of 270,777,755 people shows a weak negative correlation between the proportion of Slavs and median household income in the United States with a correlation coefficient (R) of -0.263 and weighted average of $86,398. Similarly, the statistical analysis conducted on geographies consisting of 97,712,518 people shows a mild negative correlation between the proportion of Immigrants from Armenia and median household income in the United States with a correlation coefficient (R) of -0.388 and weighted average of $83,555, a difference of 3.4%.
Median Household Income Correlation Summary
| Measurement | Slavic | Immigrants from Armenia |
| Minimum | $27,389 | $39,713 |
| Maximum | $156,479 | $152,803 |
| Range | $129,090 | $113,090 |
| Mean | $83,350 | $85,202 |
| Median | $81,875 | $85,651 |
| Interquartile 25% (IQ1) | $62,500 | $69,102 |
| Interquartile 75% (IQ3) | $94,752 | $99,318 |
| Interquartile Range (IQR) | $32,252 | $30,216 |
| Standard Deviation (Sample) | $29,906 | $22,242 |
| Standard Deviation (Population) | $29,633 | $22,064 |
Similar Demographics by Median Household Income
Demographics Similar to Slavs by Median Household Income
In terms of median household income, the demographic groups most similar to Slavs are Luxembourger ($86,418, a difference of 0.020%), Immigrants from Uzbekistan ($86,425, a difference of 0.030%), Moroccan ($86,468, a difference of 0.080%), Samoan ($86,498, a difference of 0.12%), and Immigrants from Albania ($86,534, a difference of 0.16%).
| Demographics | Rating | Rank | Median Household Income |
| Immigrants | Germany | 74.4 /100 | #154 | Good $86,764 |
| Carpatho Rusyns | 72.8 /100 | #155 | Good $86,635 |
| Immigrants | Albania | 71.5 /100 | #156 | Good $86,534 |
| Samoans | 71.0 /100 | #157 | Good $86,498 |
| Moroccans | 70.6 /100 | #158 | Good $86,468 |
| Immigrants | Uzbekistan | 70.1 /100 | #159 | Good $86,425 |
| Luxembourgers | 70.0 /100 | #160 | Good $86,418 |
| Slavs | 69.7 /100 | #161 | Good $86,398 |
| Guamanians/Chamorros | 67.7 /100 | #162 | Good $86,255 |
| Czechs | 66.4 /100 | #163 | Good $86,164 |
| Irish | 66.2 /100 | #164 | Good $86,145 |
| Norwegians | 65.3 /100 | #165 | Good $86,084 |
| Scandinavians | 65.1 /100 | #166 | Good $86,073 |
| Immigrants | Immigrants | 61.3 /100 | #167 | Good $85,818 |
| Icelanders | 61.0 /100 | #168 | Good $85,797 |
Demographics Similar to Immigrants from Armenia by Median Household Income
In terms of median household income, the demographic groups most similar to Immigrants from Armenia are Ghanaian ($83,582, a difference of 0.030%), Finnish ($83,607, a difference of 0.060%), Welsh ($83,628, a difference of 0.090%), French ($83,468, a difference of 0.10%), and Aleut ($83,446, a difference of 0.13%).
| Demographics | Rating | Rank | Median Household Income |
| Tlingit-Haida | 32.6 /100 | #188 | Fair $83,968 |
| Immigrants | Colombia | 31.7 /100 | #189 | Fair $83,902 |
| Slovaks | 30.2 /100 | #190 | Fair $83,798 |
| Iraqis | 29.6 /100 | #191 | Fair $83,753 |
| Welsh | 28.0 /100 | #192 | Fair $83,628 |
| Finns | 27.7 /100 | #193 | Fair $83,607 |
| Ghanaians | 27.4 /100 | #194 | Fair $83,582 |
| Immigrants | Armenia | 27.0 /100 | #195 | Fair $83,555 |
| French | 26.0 /100 | #196 | Fair $83,468 |
| Aleuts | 25.7 /100 | #197 | Fair $83,446 |
| Japanese | 25.1 /100 | #198 | Fair $83,395 |
| Germans | 24.6 /100 | #199 | Fair $83,358 |
| Tsimshian | 24.5 /100 | #200 | Fair $83,346 |
| Spanish | 24.4 /100 | #201 | Fair $83,343 |
| Immigrants | Thailand | 24.3 /100 | #202 | Fair $83,327 |