Slavic vs Immigrants from Guyana In Labor Force | Age 35-44
COMPARE
Slavic
Immigrants from Guyana
In Labor Force | Age 35-44
In Labor Force | Age 35-44 Comparison
Slavs
Immigrants from Guyana
84.7%
IN LABOR FORCE | AGE 35-44
90.8/ 100
METRIC RATING
124th/ 347
METRIC RANK
83.6%
IN LABOR FORCE | AGE 35-44
0.4/ 100
METRIC RATING
252nd/ 347
METRIC RANK
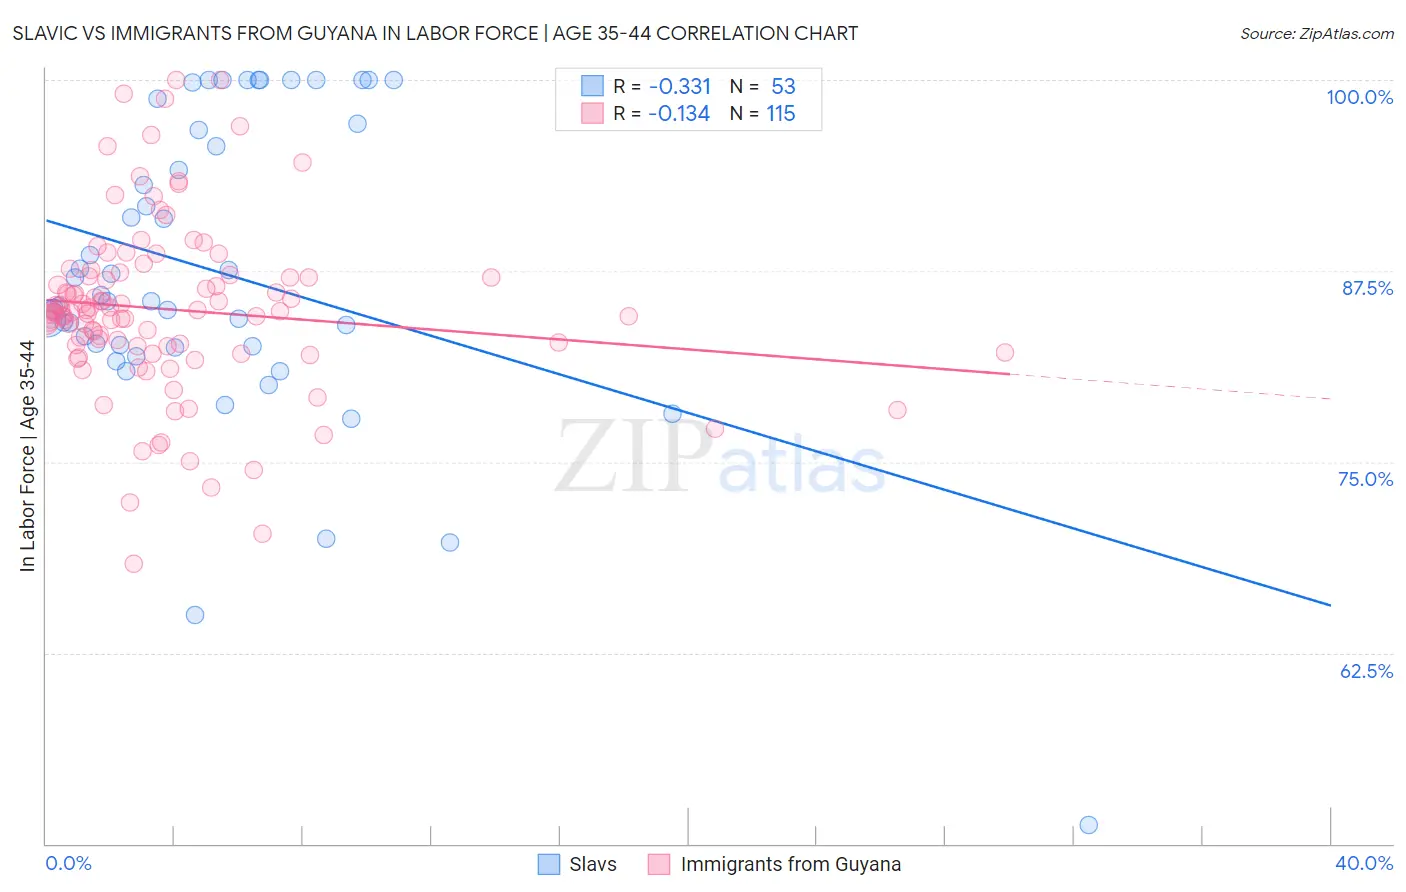
Slavic vs Immigrants from Guyana In Labor Force | Age 35-44 Correlation Chart
The statistical analysis conducted on geographies consisting of 270,832,324 people shows a mild negative correlation between the proportion of Slavs and labor force participation rate among population between the ages 35 and 44 in the United States with a correlation coefficient (R) of -0.331 and weighted average of 84.7%. Similarly, the statistical analysis conducted on geographies consisting of 183,700,489 people shows a poor negative correlation between the proportion of Immigrants from Guyana and labor force participation rate among population between the ages 35 and 44 in the United States with a correlation coefficient (R) of -0.134 and weighted average of 83.6%, a difference of 1.3%.
In Labor Force | Age 35-44 Correlation Summary
| Measurement | Slavic | Immigrants from Guyana |
| Minimum | 51.2% | 68.4% |
| Maximum | 100.0% | 100.0% |
| Range | 48.8% | 31.6% |
| Mean | 87.4% | 85.0% |
| Median | 85.5% | 84.8% |
| Interquartile 25% (IQ1) | 82.5% | 82.5% |
| Interquartile 75% (IQ3) | 96.9% | 87.2% |
| Interquartile Range (IQR) | 14.4% | 4.6% |
| Standard Deviation (Sample) | 10.1% | 5.7% |
| Standard Deviation (Population) | 10.0% | 5.7% |
Similar Demographics by In Labor Force | Age 35-44
Demographics Similar to Slavs by In Labor Force | Age 35-44
In terms of in labor force | age 35-44, the demographic groups most similar to Slavs are German (84.7%, a difference of 0.0%), Immigrants from South America (84.7%, a difference of 0.0%), Maltese (84.7%, a difference of 0.0%), Asian (84.7%, a difference of 0.0%), and Immigrants from Spain (84.7%, a difference of 0.0%).
| Demographics | Rating | Rank | In Labor Force | Age 35-44 |
| Immigrants | China | 92.3 /100 | #117 | Exceptional 84.7% |
| Immigrants | Eastern Asia | 92.1 /100 | #118 | Exceptional 84.7% |
| Burmese | 91.8 /100 | #119 | Exceptional 84.7% |
| Immigrants | Northern Europe | 91.5 /100 | #120 | Exceptional 84.7% |
| Finns | 91.2 /100 | #121 | Exceptional 84.7% |
| Germans | 91.0 /100 | #122 | Exceptional 84.7% |
| Immigrants | South America | 90.9 /100 | #123 | Exceptional 84.7% |
| Slavs | 90.8 /100 | #124 | Exceptional 84.7% |
| Maltese | 90.8 /100 | #125 | Exceptional 84.7% |
| Asians | 90.6 /100 | #126 | Exceptional 84.7% |
| Immigrants | Spain | 90.6 /100 | #127 | Exceptional 84.7% |
| Immigrants | Ghana | 90.4 /100 | #128 | Exceptional 84.7% |
| Palestinians | 89.7 /100 | #129 | Excellent 84.7% |
| Bhutanese | 89.7 /100 | #130 | Excellent 84.7% |
| Immigrants | Scotland | 89.6 /100 | #131 | Excellent 84.7% |
Demographics Similar to Immigrants from Guyana by In Labor Force | Age 35-44
In terms of in labor force | age 35-44, the demographic groups most similar to Immigrants from Guyana are Salvadoran (83.6%, a difference of 0.0%), Lebanese (83.6%, a difference of 0.0%), Tongan (83.6%, a difference of 0.010%), White/Caucasian (83.6%, a difference of 0.020%), and Immigrants from the Azores (83.6%, a difference of 0.040%).
| Demographics | Rating | Rank | In Labor Force | Age 35-44 |
| Malaysians | 1.1 /100 | #245 | Tragic 83.8% |
| Immigrants | Immigrants | 1.0 /100 | #246 | Tragic 83.7% |
| Immigrants | Armenia | 0.9 /100 | #247 | Tragic 83.7% |
| Indonesians | 0.8 /100 | #248 | Tragic 83.7% |
| Immigrants | St. Vincent and the Grenadines | 0.7 /100 | #249 | Tragic 83.7% |
| Whites/Caucasians | 0.5 /100 | #250 | Tragic 83.6% |
| Salvadorans | 0.4 /100 | #251 | Tragic 83.6% |
| Immigrants | Guyana | 0.4 /100 | #252 | Tragic 83.6% |
| Lebanese | 0.4 /100 | #253 | Tragic 83.6% |
| Tongans | 0.4 /100 | #254 | Tragic 83.6% |
| Immigrants | Azores | 0.3 /100 | #255 | Tragic 83.6% |
| Japanese | 0.3 /100 | #256 | Tragic 83.6% |
| Basques | 0.3 /100 | #257 | Tragic 83.6% |
| Tsimshian | 0.2 /100 | #258 | Tragic 83.5% |
| Immigrants | El Salvador | 0.2 /100 | #259 | Tragic 83.5% |