Slavic vs Immigrants from Guyana No Vehicles in Household
COMPARE
Slavic
Immigrants from Guyana
No Vehicles in Household
No Vehicles in Household Comparison
Slavs
Immigrants from Guyana
9.0%
NO VEHICLES IN HOUSEHOLD
98.4/ 100
METRIC RATING
98th/ 347
METRIC RANK
29.5%
NO VEHICLES IN HOUSEHOLD
0.0/ 100
METRIC RATING
341st/ 347
METRIC RANK
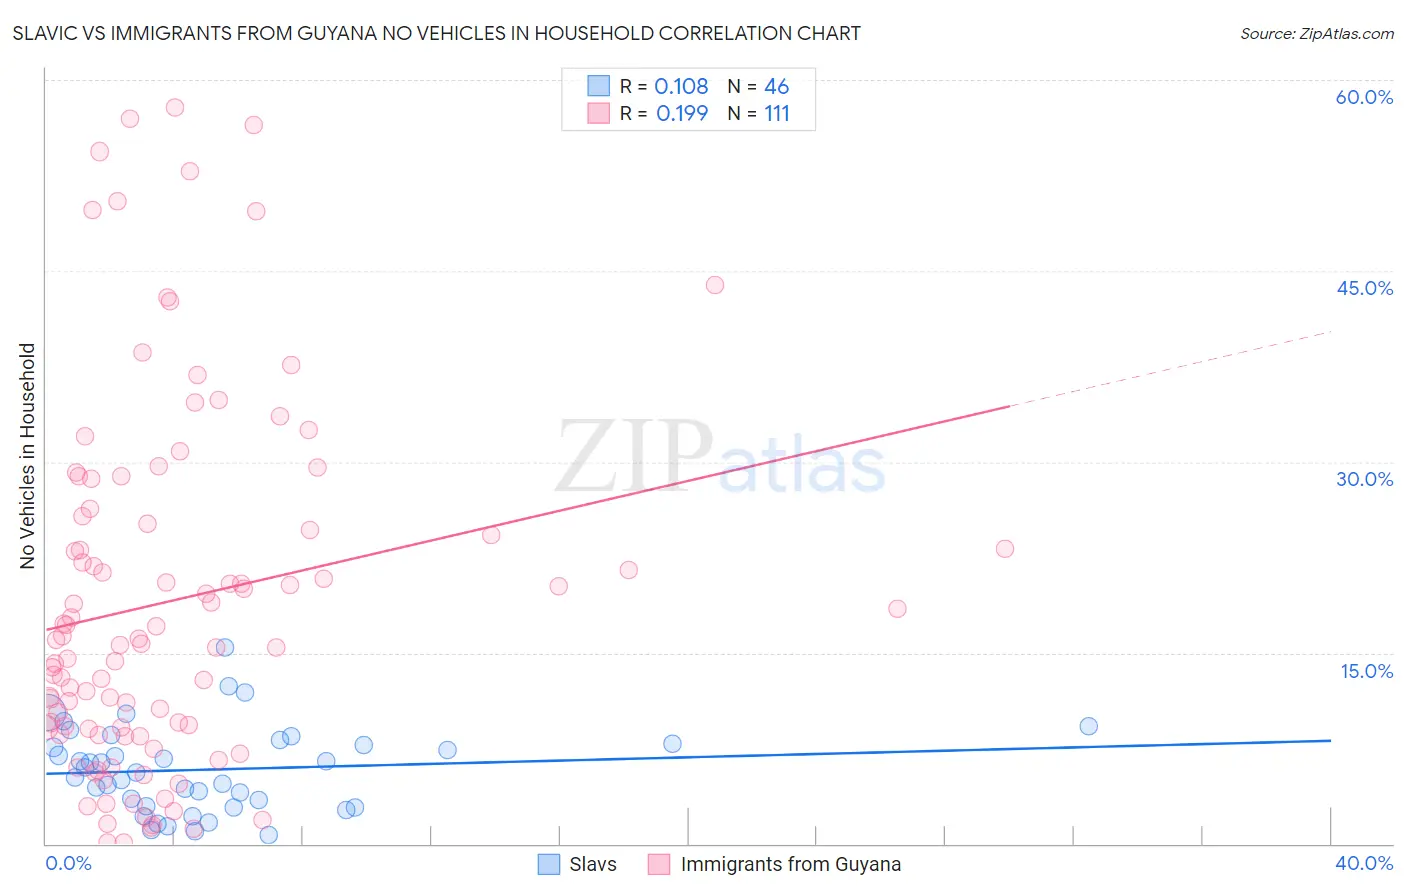
Slavic vs Immigrants from Guyana No Vehicles in Household Correlation Chart
The statistical analysis conducted on geographies consisting of 270,391,797 people shows a poor positive correlation between the proportion of Slavs and percentage of households with no vehicle available in the United States with a correlation coefficient (R) of 0.108 and weighted average of 9.0%. Similarly, the statistical analysis conducted on geographies consisting of 183,360,608 people shows a poor positive correlation between the proportion of Immigrants from Guyana and percentage of households with no vehicle available in the United States with a correlation coefficient (R) of 0.199 and weighted average of 29.5%, a difference of 229.4%.
No Vehicles in Household Correlation Summary
| Measurement | Slavic | Immigrants from Guyana |
| Minimum | 0.74% | 0.084% |
| Maximum | 15.4% | 57.8% |
| Range | 14.7% | 57.7% |
| Mean | 5.8% | 19.1% |
| Median | 5.8% | 16.0% |
| Interquartile 25% (IQ1) | 3.0% | 9.0% |
| Interquartile 75% (IQ3) | 7.8% | 25.8% |
| Interquartile Range (IQR) | 4.8% | 16.7% |
| Standard Deviation (Sample) | 3.3% | 14.1% |
| Standard Deviation (Population) | 3.3% | 14.1% |
Similar Demographics by No Vehicles in Household
Demographics Similar to Slavs by No Vehicles in Household
In terms of no vehicles in household, the demographic groups most similar to Slavs are Bulgarian (9.0%, a difference of 0.060%), Asian (9.0%, a difference of 0.24%), Pakistani (9.0%, a difference of 0.28%), Immigrants from Central America (8.9%, a difference of 0.31%), and Yugoslavian (9.0%, a difference of 0.32%).
| Demographics | Rating | Rank | No Vehicles in Household |
| Immigrants | Germany | 99.1 /100 | #91 | Exceptional 8.7% |
| Immigrants | Canada | 99.1 /100 | #92 | Exceptional 8.7% |
| Immigrants | North America | 99.1 /100 | #93 | Exceptional 8.7% |
| Austrians | 98.9 /100 | #94 | Exceptional 8.8% |
| Potawatomi | 98.8 /100 | #95 | Exceptional 8.8% |
| Immigrants | Bolivia | 98.7 /100 | #96 | Exceptional 8.9% |
| Immigrants | Central America | 98.5 /100 | #97 | Exceptional 8.9% |
| Slavs | 98.4 /100 | #98 | Exceptional 9.0% |
| Bulgarians | 98.4 /100 | #99 | Exceptional 9.0% |
| Asians | 98.3 /100 | #100 | Exceptional 9.0% |
| Pakistanis | 98.3 /100 | #101 | Exceptional 9.0% |
| Yugoslavians | 98.3 /100 | #102 | Exceptional 9.0% |
| Seminole | 98.3 /100 | #103 | Exceptional 9.0% |
| Zimbabweans | 98.0 /100 | #104 | Exceptional 9.0% |
| Spanish Americans | 97.9 /100 | #105 | Exceptional 9.1% |
Demographics Similar to Immigrants from Guyana by No Vehicles in Household
In terms of no vehicles in household, the demographic groups most similar to Immigrants from Guyana are Immigrants from Barbados (29.5%, a difference of 0.050%), Dominican (29.4%, a difference of 0.28%), Guyanese (29.3%, a difference of 0.64%), British West Indian (29.7%, a difference of 0.85%), and Inupiat (29.9%, a difference of 1.3%).
| Demographics | Rating | Rank | No Vehicles in Household |
| Immigrants | Trinidad and Tobago | 0.0 /100 | #333 | Tragic 24.6% |
| Immigrants | Bangladesh | 0.0 /100 | #334 | Tragic 25.8% |
| Barbadians | 0.0 /100 | #335 | Tragic 26.1% |
| Vietnamese | 0.0 /100 | #336 | Tragic 26.2% |
| Immigrants | Uzbekistan | 0.0 /100 | #337 | Tragic 26.7% |
| Guyanese | 0.0 /100 | #338 | Tragic 29.3% |
| Dominicans | 0.0 /100 | #339 | Tragic 29.4% |
| Immigrants | Barbados | 0.0 /100 | #340 | Tragic 29.5% |
| Immigrants | Guyana | 0.0 /100 | #341 | Tragic 29.5% |
| British West Indians | 0.0 /100 | #342 | Tragic 29.7% |
| Inupiat | 0.0 /100 | #343 | Tragic 29.9% |
| Immigrants | Dominican Republic | 0.0 /100 | #344 | Tragic 31.4% |
| Immigrants | St. Vincent and the Grenadines | 0.0 /100 | #345 | Tragic 35.4% |
| Immigrants | Grenada | 0.0 /100 | #346 | Tragic 37.5% |
| Yup'ik | 0.0 /100 | #347 | Tragic 45.9% |