Immigrants from Bahamas vs Immigrants from Guyana Median Household Income
COMPARE
Immigrants from Bahamas
Immigrants from Guyana
Median Household Income
Median Household Income Comparison
Immigrants from Bahamas
Immigrants from Guyana
$71,349
MEDIAN HOUSEHOLD INCOME
0.0/ 100
METRIC RATING
313th/ 347
METRIC RANK
$80,324
MEDIAN HOUSEHOLD INCOME
4.5/ 100
METRIC RATING
235th/ 347
METRIC RANK
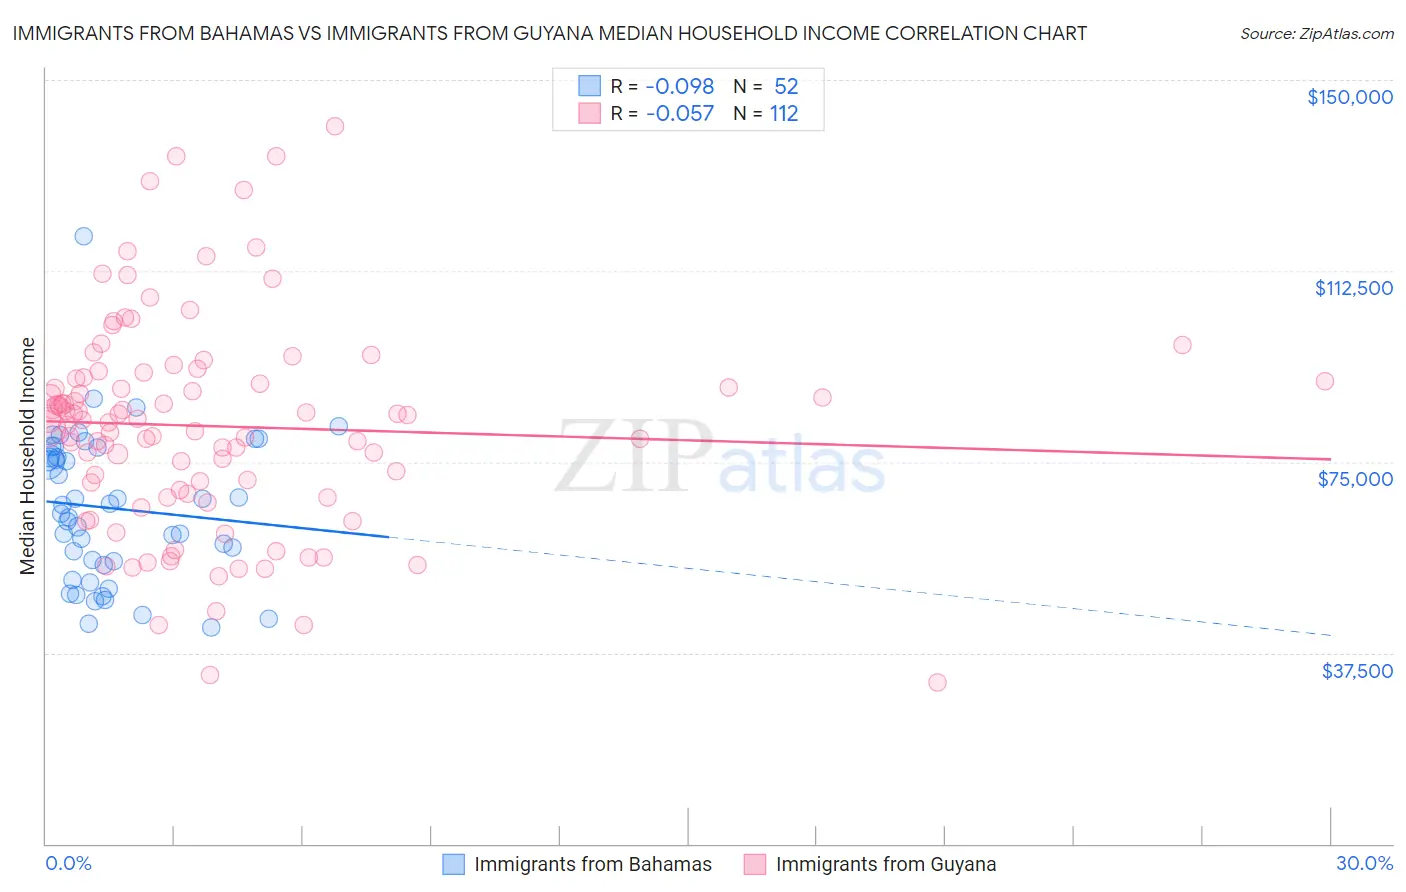
Immigrants from Bahamas vs Immigrants from Guyana Median Household Income Correlation Chart
The statistical analysis conducted on geographies consisting of 104,583,931 people shows a slight negative correlation between the proportion of Immigrants from Bahamas and median household income in the United States with a correlation coefficient (R) of -0.098 and weighted average of $71,349. Similarly, the statistical analysis conducted on geographies consisting of 183,660,864 people shows a slight negative correlation between the proportion of Immigrants from Guyana and median household income in the United States with a correlation coefficient (R) of -0.057 and weighted average of $80,324, a difference of 12.6%.
Median Household Income Correlation Summary
| Measurement | Immigrants from Bahamas | Immigrants from Guyana |
| Minimum | $42,496 | $31,571 |
| Maximum | $119,201 | $140,893 |
| Range | $76,705 | $109,322 |
| Mean | $65,863 | $81,995 |
| Median | $65,628 | $83,283 |
| Interquartile 25% (IQ1) | $55,065 | $69,032 |
| Interquartile 75% (IQ3) | $76,891 | $91,451 |
| Interquartile Range (IQR) | $21,825 | $22,418 |
| Standard Deviation (Sample) | $14,679 | $20,739 |
| Standard Deviation (Population) | $14,537 | $20,646 |
Similar Demographics by Median Household Income
Demographics Similar to Immigrants from Bahamas by Median Household Income
In terms of median household income, the demographic groups most similar to Immigrants from Bahamas are Dominican ($71,302, a difference of 0.060%), Immigrants from Honduras ($71,452, a difference of 0.15%), Ottawa ($70,984, a difference of 0.51%), Apache ($70,927, a difference of 0.59%), and Immigrants from Zaire ($71,801, a difference of 0.63%).
| Demographics | Rating | Rank | Median Household Income |
| Potawatomi | 0.0 /100 | #306 | Tragic $72,576 |
| Ute | 0.0 /100 | #307 | Tragic $72,402 |
| Yakama | 0.0 /100 | #308 | Tragic $72,225 |
| Immigrants | Caribbean | 0.0 /100 | #309 | Tragic $71,860 |
| U.S. Virgin Islanders | 0.0 /100 | #310 | Tragic $71,853 |
| Immigrants | Zaire | 0.0 /100 | #311 | Tragic $71,801 |
| Immigrants | Honduras | 0.0 /100 | #312 | Tragic $71,452 |
| Immigrants | Bahamas | 0.0 /100 | #313 | Tragic $71,349 |
| Dominicans | 0.0 /100 | #314 | Tragic $71,302 |
| Ottawa | 0.0 /100 | #315 | Tragic $70,984 |
| Apache | 0.0 /100 | #316 | Tragic $70,927 |
| Cajuns | 0.0 /100 | #317 | Tragic $70,605 |
| Chippewa | 0.0 /100 | #318 | Tragic $70,539 |
| Immigrants | Dominican Republic | 0.0 /100 | #319 | Tragic $70,208 |
| Colville | 0.0 /100 | #320 | Tragic $70,094 |
Demographics Similar to Immigrants from Guyana by Median Household Income
In terms of median household income, the demographic groups most similar to Immigrants from Guyana are Immigrants from Ecuador ($80,341, a difference of 0.020%), Immigrants from the Azores ($80,357, a difference of 0.040%), Immigrants from Trinidad and Tobago ($80,373, a difference of 0.060%), Bermudan ($80,406, a difference of 0.10%), and Trinidadian and Tobagonian ($80,402, a difference of 0.10%).
| Demographics | Rating | Rank | Median Household Income |
| Immigrants | Bangladesh | 5.7 /100 | #228 | Tragic $80,722 |
| Delaware | 5.0 /100 | #229 | Tragic $80,527 |
| Bermudans | 4.7 /100 | #230 | Tragic $80,406 |
| Trinidadians and Tobagonians | 4.7 /100 | #231 | Tragic $80,402 |
| Immigrants | Trinidad and Tobago | 4.6 /100 | #232 | Tragic $80,373 |
| Immigrants | Azores | 4.5 /100 | #233 | Tragic $80,357 |
| Immigrants | Ecuador | 4.5 /100 | #234 | Tragic $80,341 |
| Immigrants | Guyana | 4.5 /100 | #235 | Tragic $80,324 |
| Immigrants | Bosnia and Herzegovina | 3.4 /100 | #236 | Tragic $79,888 |
| Nicaraguans | 3.1 /100 | #237 | Tragic $79,737 |
| Barbadians | 3.0 /100 | #238 | Tragic $79,664 |
| Alaska Natives | 2.7 /100 | #239 | Tragic $79,509 |
| Immigrants | Western Africa | 2.7 /100 | #240 | Tragic $79,490 |
| Immigrants | Nonimmigrants | 2.6 /100 | #241 | Tragic $79,429 |
| Immigrants | Sudan | 2.1 /100 | #242 | Tragic $79,103 |