Slavic vs Immigrants from Guyana Householder Income Ages 25 - 44 years
COMPARE
Slavic
Immigrants from Guyana
Householder Income Ages 25 - 44 years
Householder Income Ages 25 - 44 years Comparison
Slavs
Immigrants from Guyana
$96,377
HOUSEHOLDER INCOME AGES 25 - 44 YEARS
73.2/ 100
METRIC RATING
154th/ 347
METRIC RANK
$89,586
HOUSEHOLDER INCOME AGES 25 - 44 YEARS
5.9/ 100
METRIC RATING
223rd/ 347
METRIC RANK
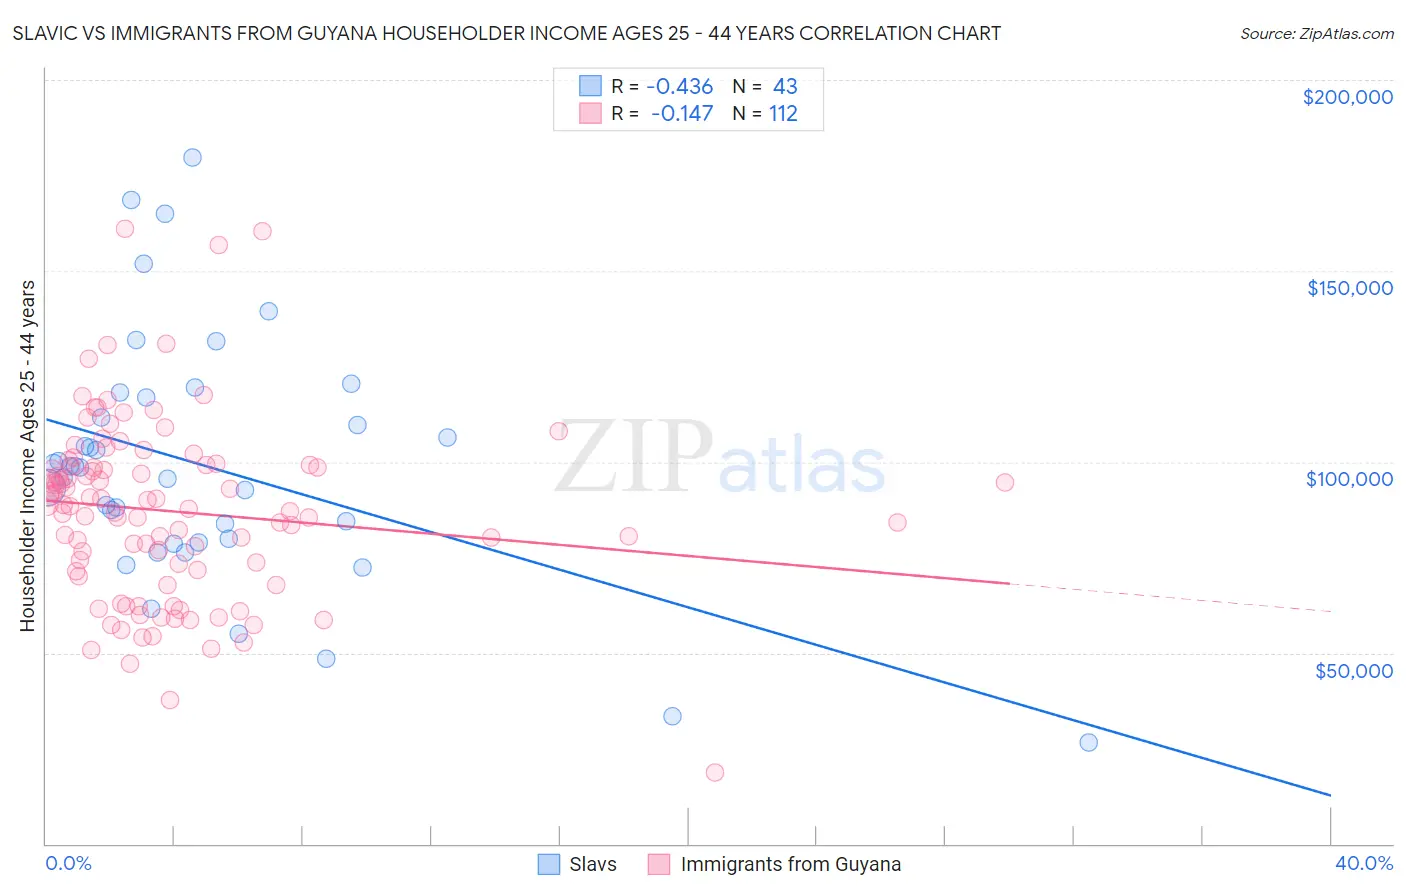
Slavic vs Immigrants from Guyana Householder Income Ages 25 - 44 years Correlation Chart
The statistical analysis conducted on geographies consisting of 270,306,430 people shows a moderate negative correlation between the proportion of Slavs and household income with householder between the ages 25 and 44 in the United States with a correlation coefficient (R) of -0.436 and weighted average of $96,377. Similarly, the statistical analysis conducted on geographies consisting of 183,521,804 people shows a poor negative correlation between the proportion of Immigrants from Guyana and household income with householder between the ages 25 and 44 in the United States with a correlation coefficient (R) of -0.147 and weighted average of $89,586, a difference of 7.6%.
Householder Income Ages 25 - 44 years Correlation Summary
| Measurement | Slavic | Immigrants from Guyana |
| Minimum | $26,507 | $18,657 |
| Maximum | $179,830 | $161,089 |
| Range | $153,323 | $142,432 |
| Mean | $98,780 | $87,058 |
| Median | $98,521 | $88,583 |
| Interquartile 25% (IQ1) | $78,750 | $71,493 |
| Interquartile 75% (IQ3) | $116,887 | $98,895 |
| Interquartile Range (IQR) | $38,137 | $27,402 |
| Standard Deviation (Sample) | $32,452 | $23,727 |
| Standard Deviation (Population) | $32,072 | $23,620 |
Similar Demographics by Householder Income Ages 25 - 44 years
Demographics Similar to Slavs by Householder Income Ages 25 - 44 years
In terms of householder income ages 25 - 44 years, the demographic groups most similar to Slavs are Slovene ($96,439, a difference of 0.060%), South American Indian ($96,497, a difference of 0.12%), Czech ($96,525, a difference of 0.15%), Moroccan ($96,117, a difference of 0.27%), and Ugandan ($96,667, a difference of 0.30%).
| Demographics | Rating | Rank | Householder Income Ages 25 - 44 years |
| Immigrants | Syria | 77.4 /100 | #147 | Good $96,789 |
| Irish | 76.9 /100 | #148 | Good $96,730 |
| Basques | 76.6 /100 | #149 | Good $96,709 |
| Ugandans | 76.2 /100 | #150 | Good $96,667 |
| Czechs | 74.8 /100 | #151 | Good $96,525 |
| South American Indians | 74.5 /100 | #152 | Good $96,497 |
| Slovenes | 73.9 /100 | #153 | Good $96,439 |
| Slavs | 73.2 /100 | #154 | Good $96,377 |
| Moroccans | 70.3 /100 | #155 | Good $96,117 |
| Immigrants | Germany | 67.9 /100 | #156 | Good $95,913 |
| Immigrants | Uganda | 65.2 /100 | #157 | Good $95,698 |
| Scandinavians | 63.9 /100 | #158 | Good $95,596 |
| Costa Ricans | 63.5 /100 | #159 | Good $95,565 |
| Icelanders | 63.4 /100 | #160 | Good $95,560 |
| Immigrants | Portugal | 62.8 /100 | #161 | Good $95,512 |
Demographics Similar to Immigrants from Guyana by Householder Income Ages 25 - 44 years
In terms of householder income ages 25 - 44 years, the demographic groups most similar to Immigrants from Guyana are Barbadian ($89,565, a difference of 0.020%), Immigrants from Ecuador ($89,673, a difference of 0.10%), Immigrants from Panama ($89,451, a difference of 0.15%), Immigrants from Iraq ($89,444, a difference of 0.16%), and Immigrants from Trinidad and Tobago ($89,748, a difference of 0.18%).
| Demographics | Rating | Rank | Householder Income Ages 25 - 44 years |
| Ghanaians | 7.9 /100 | #216 | Tragic $90,137 |
| Scotch-Irish | 7.3 /100 | #217 | Tragic $89,969 |
| Guyanese | 7.1 /100 | #218 | Tragic $89,940 |
| Delaware | 6.9 /100 | #219 | Tragic $89,876 |
| Trinidadians and Tobagonians | 6.8 /100 | #220 | Tragic $89,856 |
| Immigrants | Trinidad and Tobago | 6.5 /100 | #221 | Tragic $89,748 |
| Immigrants | Ecuador | 6.2 /100 | #222 | Tragic $89,673 |
| Immigrants | Guyana | 5.9 /100 | #223 | Tragic $89,586 |
| Barbadians | 5.9 /100 | #224 | Tragic $89,565 |
| Immigrants | Panama | 5.5 /100 | #225 | Tragic $89,451 |
| Immigrants | Iraq | 5.5 /100 | #226 | Tragic $89,444 |
| Immigrants | St. Vincent and the Grenadines | 4.1 /100 | #227 | Tragic $88,888 |
| Immigrants | Bosnia and Herzegovina | 4.0 /100 | #228 | Tragic $88,819 |
| Immigrants | Barbados | 3.7 /100 | #229 | Tragic $88,687 |
| Alaskan Athabascans | 3.3 /100 | #230 | Tragic $88,446 |