Slavic vs Italian Median Family Income
COMPARE
Slavic
Italian
Median Family Income
Median Family Income Comparison
Slavs
Italians
$105,144
MEDIAN FAMILY INCOME
77.9/ 100
METRIC RATING
153rd/ 347
METRIC RANK
$112,372
MEDIAN FAMILY INCOME
99.3/ 100
METRIC RATING
79th/ 347
METRIC RANK
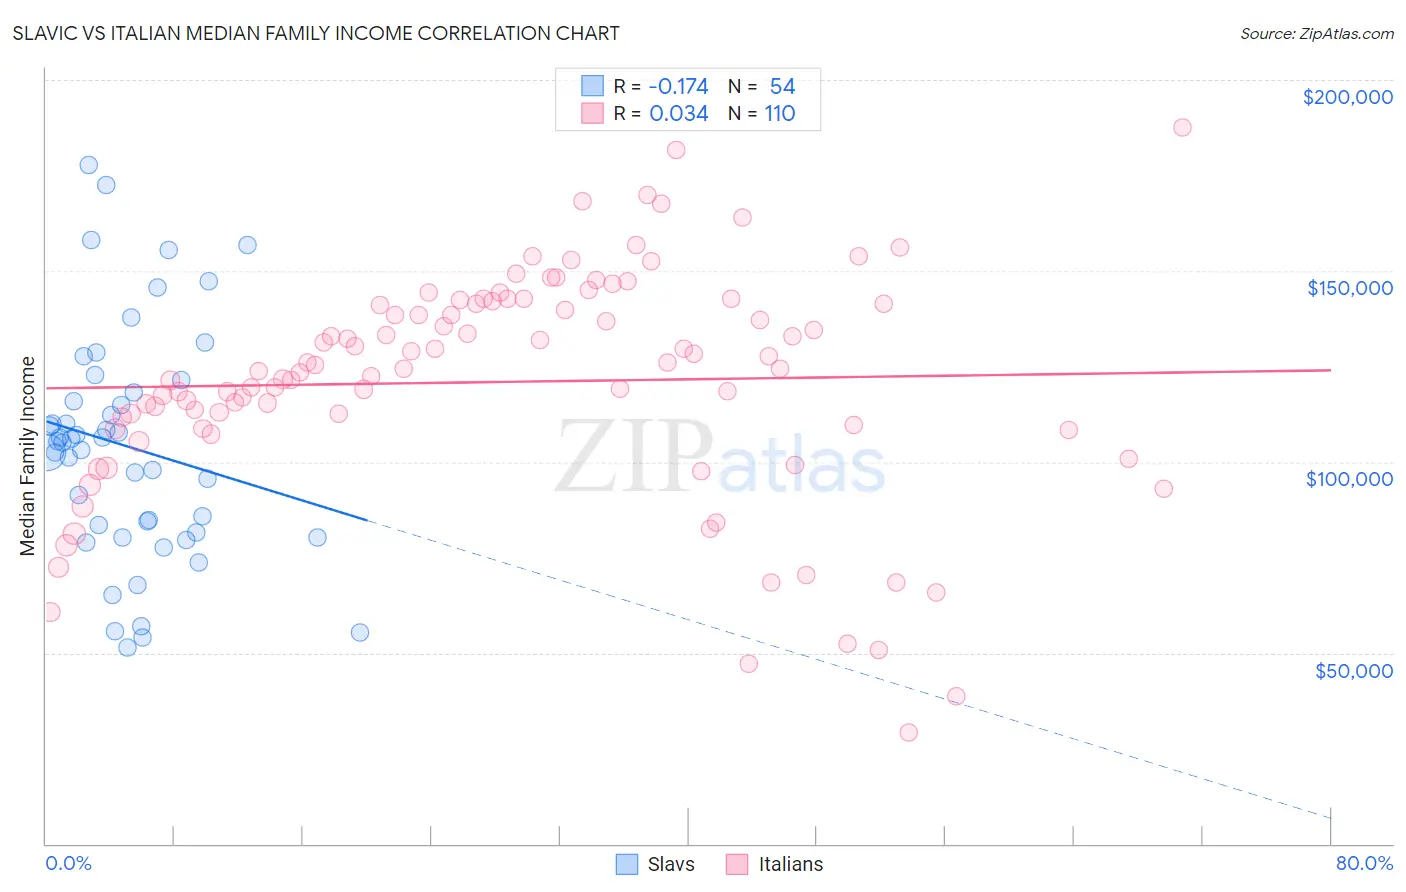
Slavic vs Italian Median Family Income Correlation Chart
The statistical analysis conducted on geographies consisting of 270,767,146 people shows a poor negative correlation between the proportion of Slavs and median family income in the United States with a correlation coefficient (R) of -0.174 and weighted average of $105,144. Similarly, the statistical analysis conducted on geographies consisting of 573,577,763 people shows no correlation between the proportion of Italians and median family income in the United States with a correlation coefficient (R) of 0.034 and weighted average of $112,372, a difference of 6.9%.
Median Family Income Correlation Summary
| Measurement | Slavic | Italian |
| Minimum | $51,429 | $29,018 |
| Maximum | $177,700 | $187,652 |
| Range | $126,271 | $158,634 |
| Mean | $103,941 | $120,937 |
| Median | $105,172 | $124,369 |
| Interquartile 25% (IQ1) | $81,417 | $108,740 |
| Interquartile 75% (IQ3) | $118,102 | $141,554 |
| Interquartile Range (IQR) | $36,685 | $32,814 |
| Standard Deviation (Sample) | $30,026 | $29,913 |
| Standard Deviation (Population) | $29,746 | $29,777 |
Similar Demographics by Median Family Income
Demographics Similar to Slavs by Median Family Income
In terms of median family income, the demographic groups most similar to Slavs are Immigrants from Albania ($105,285, a difference of 0.13%), Immigrants from Nepal ($104,966, a difference of 0.17%), Native Hawaiian ($104,910, a difference of 0.22%), Peruvian ($105,444, a difference of 0.28%), and Irish ($105,453, a difference of 0.29%).
| Demographics | Rating | Rank | Median Family Income |
| Czechs | 83.4 /100 | #146 | Excellent $105,839 |
| Immigrants | Chile | 82.1 /100 | #147 | Excellent $105,655 |
| Hungarians | 81.7 /100 | #148 | Excellent $105,609 |
| Immigrants | Germany | 80.9 /100 | #149 | Excellent $105,507 |
| Irish | 80.5 /100 | #150 | Excellent $105,453 |
| Peruvians | 80.4 /100 | #151 | Excellent $105,444 |
| Immigrants | Albania | 79.1 /100 | #152 | Good $105,285 |
| Slavs | 77.9 /100 | #153 | Good $105,144 |
| Immigrants | Nepal | 76.3 /100 | #154 | Good $104,966 |
| Native Hawaiians | 75.8 /100 | #155 | Good $104,910 |
| Basques | 74.4 /100 | #156 | Good $104,760 |
| Moroccans | 71.6 /100 | #157 | Good $104,488 |
| Scandinavians | 70.8 /100 | #158 | Good $104,410 |
| Swiss | 70.7 /100 | #159 | Good $104,396 |
| Scottish | 69.5 /100 | #160 | Good $104,288 |
Demographics Similar to Italians by Median Family Income
In terms of median family income, the demographic groups most similar to Italians are Immigrants from Canada ($112,374, a difference of 0.0%), Immigrants from Croatia ($112,323, a difference of 0.040%), Immigrants from Eastern Europe ($112,527, a difference of 0.14%), Immigrants from North America ($112,151, a difference of 0.20%), and Argentinean ($112,665, a difference of 0.26%).
| Demographics | Rating | Rank | Median Family Income |
| Afghans | 99.5 /100 | #72 | Exceptional $112,971 |
| Laotians | 99.5 /100 | #73 | Exceptional $112,859 |
| Immigrants | Italy | 99.4 /100 | #74 | Exceptional $112,848 |
| Immigrants | Western Europe | 99.4 /100 | #75 | Exceptional $112,688 |
| Argentineans | 99.4 /100 | #76 | Exceptional $112,665 |
| Immigrants | Eastern Europe | 99.4 /100 | #77 | Exceptional $112,527 |
| Immigrants | Canada | 99.3 /100 | #78 | Exceptional $112,374 |
| Italians | 99.3 /100 | #79 | Exceptional $112,372 |
| Immigrants | Croatia | 99.3 /100 | #80 | Exceptional $112,323 |
| Immigrants | North America | 99.2 /100 | #81 | Exceptional $112,151 |
| Immigrants | England | 99.2 /100 | #82 | Exceptional $112,038 |
| Immigrants | Egypt | 99.0 /100 | #83 | Exceptional $111,689 |
| Immigrants | Hungary | 98.8 /100 | #84 | Exceptional $111,378 |
| Croatians | 98.8 /100 | #85 | Exceptional $111,370 |
| Ukrainians | 98.8 /100 | #86 | Exceptional $111,368 |