Slavic vs Alaskan Athabascan Householder Income Ages 45 - 64 years
COMPARE
Slavic
Alaskan Athabascan
Householder Income Ages 45 - 64 years
Householder Income Ages 45 - 64 years Comparison
Slavs
Alaskan Athabascans
$102,629
HOUSEHOLDER INCOME AGES 45 - 64 YEARS
76.1/ 100
METRIC RATING
158th/ 347
METRIC RANK
$90,951
HOUSEHOLDER INCOME AGES 45 - 64 YEARS
0.9/ 100
METRIC RATING
247th/ 347
METRIC RANK
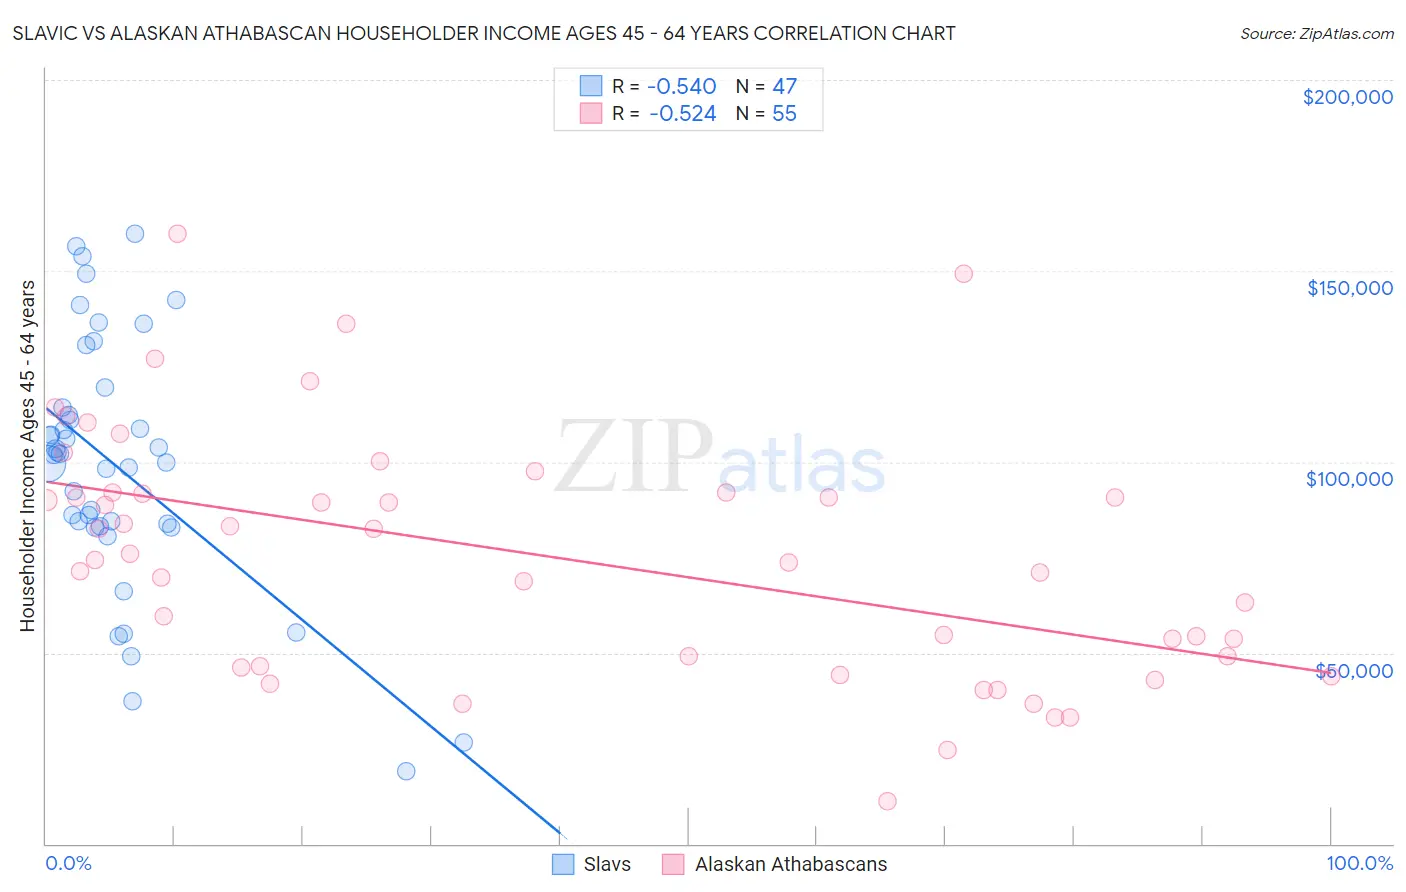
Slavic vs Alaskan Athabascan Householder Income Ages 45 - 64 years Correlation Chart
The statistical analysis conducted on geographies consisting of 270,616,686 people shows a substantial negative correlation between the proportion of Slavs and household income with householder between the ages 45 and 64 in the United States with a correlation coefficient (R) of -0.540 and weighted average of $102,629. Similarly, the statistical analysis conducted on geographies consisting of 45,798,258 people shows a substantial negative correlation between the proportion of Alaskan Athabascans and household income with householder between the ages 45 and 64 in the United States with a correlation coefficient (R) of -0.524 and weighted average of $90,951, a difference of 12.8%.
Householder Income Ages 45 - 64 years Correlation Summary
| Measurement | Slavic | Alaskan Athabascan |
| Minimum | $18,979 | $11,250 |
| Maximum | $159,583 | $159,813 |
| Range | $140,604 | $148,563 |
| Mean | $98,663 | $75,223 |
| Median | $101,881 | $74,256 |
| Interquartile 25% (IQ1) | $83,250 | $46,429 |
| Interquartile 75% (IQ3) | $114,292 | $91,990 |
| Interquartile Range (IQR) | $31,042 | $45,561 |
| Standard Deviation (Sample) | $32,811 | $32,152 |
| Standard Deviation (Population) | $32,460 | $31,858 |
Similar Demographics by Householder Income Ages 45 - 64 years
Demographics Similar to Slavs by Householder Income Ages 45 - 64 years
In terms of householder income ages 45 - 64 years, the demographic groups most similar to Slavs are Immigrants from Ethiopia ($102,763, a difference of 0.13%), Carpatho Rusyn ($102,777, a difference of 0.14%), Costa Rican ($102,779, a difference of 0.15%), Sierra Leonean ($102,427, a difference of 0.20%), and Slovene ($102,885, a difference of 0.25%).
| Demographics | Rating | Rank | Householder Income Ages 45 - 64 years |
| Swiss | 79.9 /100 | #151 | Good $103,071 |
| Irish | 79.8 /100 | #152 | Good $103,067 |
| Scandinavians | 79.0 /100 | #153 | Good $102,969 |
| Slovenes | 78.3 /100 | #154 | Good $102,885 |
| Costa Ricans | 77.4 /100 | #155 | Good $102,779 |
| Carpatho Rusyns | 77.4 /100 | #156 | Good $102,777 |
| Immigrants | Ethiopia | 77.3 /100 | #157 | Good $102,763 |
| Slavs | 76.1 /100 | #158 | Good $102,629 |
| Sierra Leoneans | 74.2 /100 | #159 | Good $102,427 |
| Icelanders | 72.5 /100 | #160 | Good $102,261 |
| Immigrants | Nepal | 71.8 /100 | #161 | Good $102,190 |
| Scottish | 71.1 /100 | #162 | Good $102,123 |
| English | 70.1 /100 | #163 | Good $102,021 |
| Immigrants | Morocco | 70.0 /100 | #164 | Good $102,015 |
| Immigrants | Albania | 69.4 /100 | #165 | Good $101,957 |
Demographics Similar to Alaskan Athabascans by Householder Income Ages 45 - 64 years
In terms of householder income ages 45 - 64 years, the demographic groups most similar to Alaskan Athabascans are Central American ($90,951, a difference of 0.0%), Guyanese ($90,966, a difference of 0.020%), Immigrants from Laos ($90,909, a difference of 0.050%), Mexican American Indian ($90,811, a difference of 0.15%), and Subsaharan African ($90,691, a difference of 0.29%).
| Demographics | Rating | Rank | Householder Income Ages 45 - 64 years |
| Immigrants | Burma/Myanmar | 1.1 /100 | #240 | Tragic $91,385 |
| Trinidadians and Tobagonians | 1.1 /100 | #241 | Tragic $91,357 |
| Inupiat | 1.1 /100 | #242 | Tragic $91,355 |
| Immigrants | Trinidad and Tobago | 1.1 /100 | #243 | Tragic $91,347 |
| Immigrants | Middle Africa | 1.1 /100 | #244 | Tragic $91,293 |
| Guyanese | 0.9 /100 | #245 | Tragic $90,966 |
| Central Americans | 0.9 /100 | #246 | Tragic $90,951 |
| Alaskan Athabascans | 0.9 /100 | #247 | Tragic $90,951 |
| Immigrants | Laos | 0.9 /100 | #248 | Tragic $90,909 |
| Mexican American Indians | 0.8 /100 | #249 | Tragic $90,811 |
| Sub-Saharan Africans | 0.8 /100 | #250 | Tragic $90,691 |
| Americans | 0.7 /100 | #251 | Tragic $90,536 |
| Marshallese | 0.7 /100 | #252 | Tragic $90,455 |
| Barbadians | 0.6 /100 | #253 | Tragic $90,266 |
| Immigrants | Guyana | 0.6 /100 | #254 | Tragic $90,186 |