Assyrian/Chaldean/Syriac vs German Householder Income Ages 45 - 64 years
COMPARE
Assyrian/Chaldean/Syriac
German
Householder Income Ages 45 - 64 years
Householder Income Ages 45 - 64 years Comparison
Assyrians/Chaldeans/Syriacs
Germans
$110,201
HOUSEHOLDER INCOME AGES 45 - 64 YEARS
99.3/ 100
METRIC RATING
72nd/ 347
METRIC RANK
$100,224
HOUSEHOLDER INCOME AGES 45 - 64 YEARS
48.8/ 100
METRIC RATING
175th/ 347
METRIC RANK
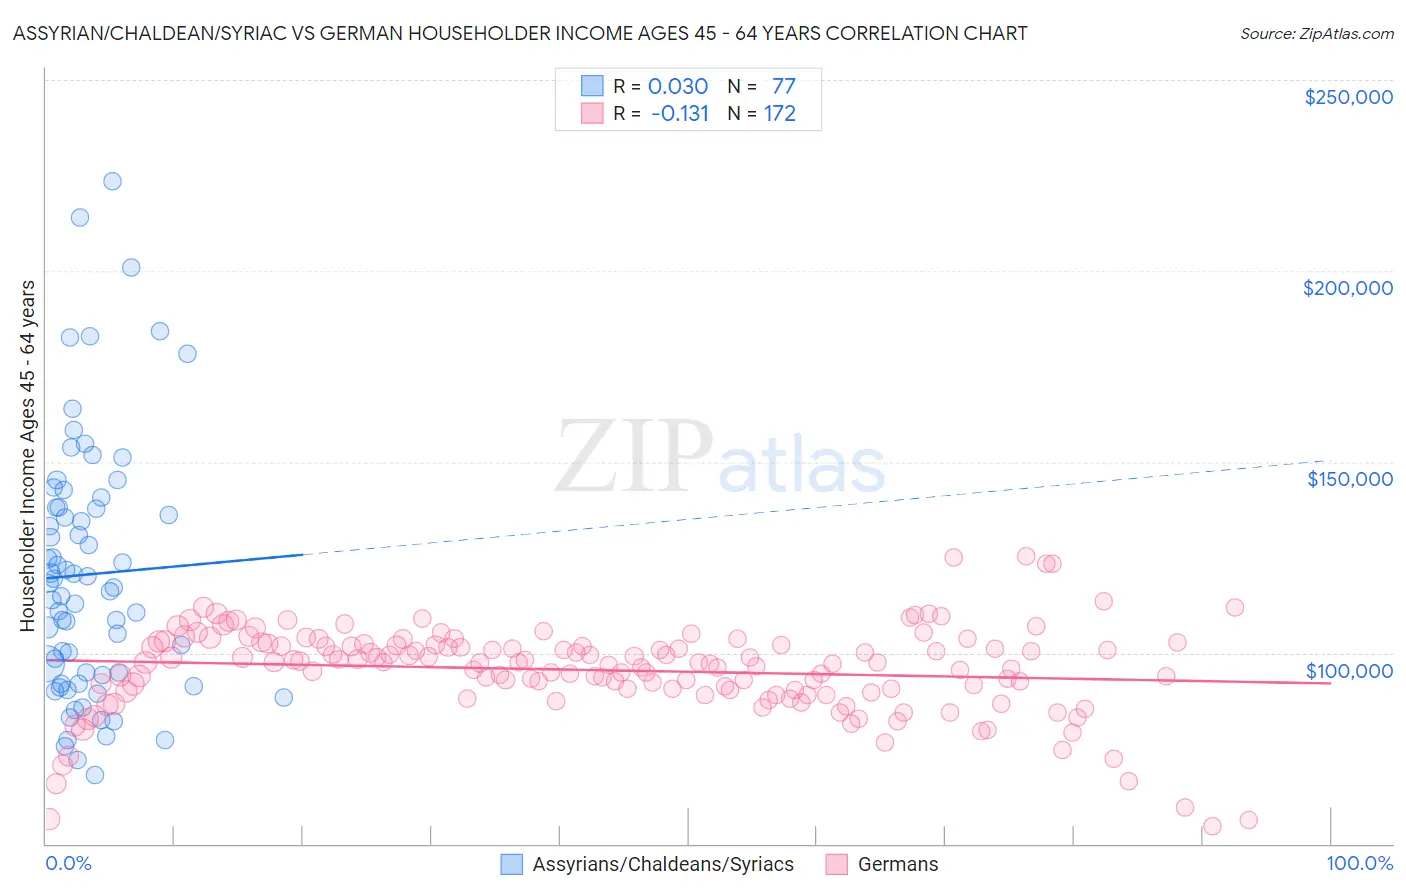
Assyrian/Chaldean/Syriac vs German Householder Income Ages 45 - 64 years Correlation Chart
The statistical analysis conducted on geographies consisting of 110,244,252 people shows no correlation between the proportion of Assyrians/Chaldeans/Syriacs and household income with householder between the ages 45 and 64 in the United States with a correlation coefficient (R) of 0.030 and weighted average of $110,201. Similarly, the statistical analysis conducted on geographies consisting of 575,941,982 people shows a poor negative correlation between the proportion of Germans and household income with householder between the ages 45 and 64 in the United States with a correlation coefficient (R) of -0.131 and weighted average of $100,224, a difference of 10.0%.
Householder Income Ages 45 - 64 years Correlation Summary
| Measurement | Assyrian/Chaldean/Syriac | German |
| Minimum | $67,992 | $54,688 |
| Maximum | $223,409 | $125,293 |
| Range | $155,417 | $70,605 |
| Mean | $120,547 | $95,438 |
| Median | $117,054 | $97,438 |
| Interquartile 25% (IQ1) | $93,085 | $90,029 |
| Interquartile 75% (IQ3) | $138,155 | $102,031 |
| Interquartile Range (IQR) | $45,070 | $12,003 |
| Standard Deviation (Sample) | $33,489 | $11,697 |
| Standard Deviation (Population) | $33,271 | $11,663 |
Similar Demographics by Householder Income Ages 45 - 64 years
Demographics Similar to Assyrians/Chaldeans/Syriacs by Householder Income Ages 45 - 64 years
In terms of householder income ages 45 - 64 years, the demographic groups most similar to Assyrians/Chaldeans/Syriacs are Italian ($110,224, a difference of 0.020%), Argentinean ($110,103, a difference of 0.090%), Korean ($110,334, a difference of 0.12%), Immigrants from Italy ($110,434, a difference of 0.21%), and Immigrants from Egypt ($109,941, a difference of 0.24%).
| Demographics | Rating | Rank | Householder Income Ages 45 - 64 years |
| Immigrants | Belarus | 99.6 /100 | #65 | Exceptional $111,430 |
| New Zealanders | 99.6 /100 | #66 | Exceptional $111,286 |
| Laotians | 99.5 /100 | #67 | Exceptional $111,051 |
| Immigrants | Romania | 99.4 /100 | #68 | Exceptional $110,633 |
| Immigrants | Italy | 99.4 /100 | #69 | Exceptional $110,434 |
| Koreans | 99.3 /100 | #70 | Exceptional $110,334 |
| Italians | 99.3 /100 | #71 | Exceptional $110,224 |
| Assyrians/Chaldeans/Syriacs | 99.3 /100 | #72 | Exceptional $110,201 |
| Argentineans | 99.3 /100 | #73 | Exceptional $110,103 |
| Immigrants | Egypt | 99.2 /100 | #74 | Exceptional $109,941 |
| South Africans | 99.1 /100 | #75 | Exceptional $109,719 |
| Paraguayans | 99.0 /100 | #76 | Exceptional $109,447 |
| Immigrants | England | 99.0 /100 | #77 | Exceptional $109,446 |
| Immigrants | Canada | 99.0 /100 | #78 | Exceptional $109,402 |
| Immigrants | Bulgaria | 98.9 /100 | #79 | Exceptional $109,379 |
Demographics Similar to Germans by Householder Income Ages 45 - 64 years
In terms of householder income ages 45 - 64 years, the demographic groups most similar to Germans are Immigrants from Costa Rica ($100,141, a difference of 0.080%), Moroccan ($100,138, a difference of 0.090%), Welsh ($100,322, a difference of 0.10%), Immigrants from Cameroon ($100,084, a difference of 0.14%), and Belgian ($100,060, a difference of 0.16%).
| Demographics | Rating | Rank | Householder Income Ages 45 - 64 years |
| South American Indians | 60.5 /100 | #168 | Good $101,171 |
| Guamanians/Chamorros | 60.5 /100 | #169 | Good $101,170 |
| Slovaks | 58.8 /100 | #170 | Average $101,029 |
| South Americans | 56.4 /100 | #171 | Average $100,837 |
| Immigrants | Uzbekistan | 52.5 /100 | #172 | Average $100,523 |
| Alsatians | 51.4 /100 | #173 | Average $100,435 |
| Welsh | 50.0 /100 | #174 | Average $100,322 |
| Germans | 48.8 /100 | #175 | Average $100,224 |
| Immigrants | Costa Rica | 47.7 /100 | #176 | Average $100,141 |
| Moroccans | 47.7 /100 | #177 | Average $100,138 |
| Immigrants | Cameroon | 47.0 /100 | #178 | Average $100,084 |
| Belgians | 46.7 /100 | #179 | Average $100,060 |
| Aleuts | 46.6 /100 | #180 | Average $100,052 |
| Immigrants | Immigrants | 45.3 /100 | #181 | Average $99,943 |
| Finns | 44.8 /100 | #182 | Average $99,904 |