Filipino vs German Householder Income Ages 45 - 64 years
COMPARE
Filipino
German
Householder Income Ages 45 - 64 years
Householder Income Ages 45 - 64 years Comparison
Filipinos
Germans
$134,910
HOUSEHOLDER INCOME AGES 45 - 64 YEARS
100.0/ 100
METRIC RATING
2nd/ 347
METRIC RANK
$100,224
HOUSEHOLDER INCOME AGES 45 - 64 YEARS
48.8/ 100
METRIC RATING
175th/ 347
METRIC RANK
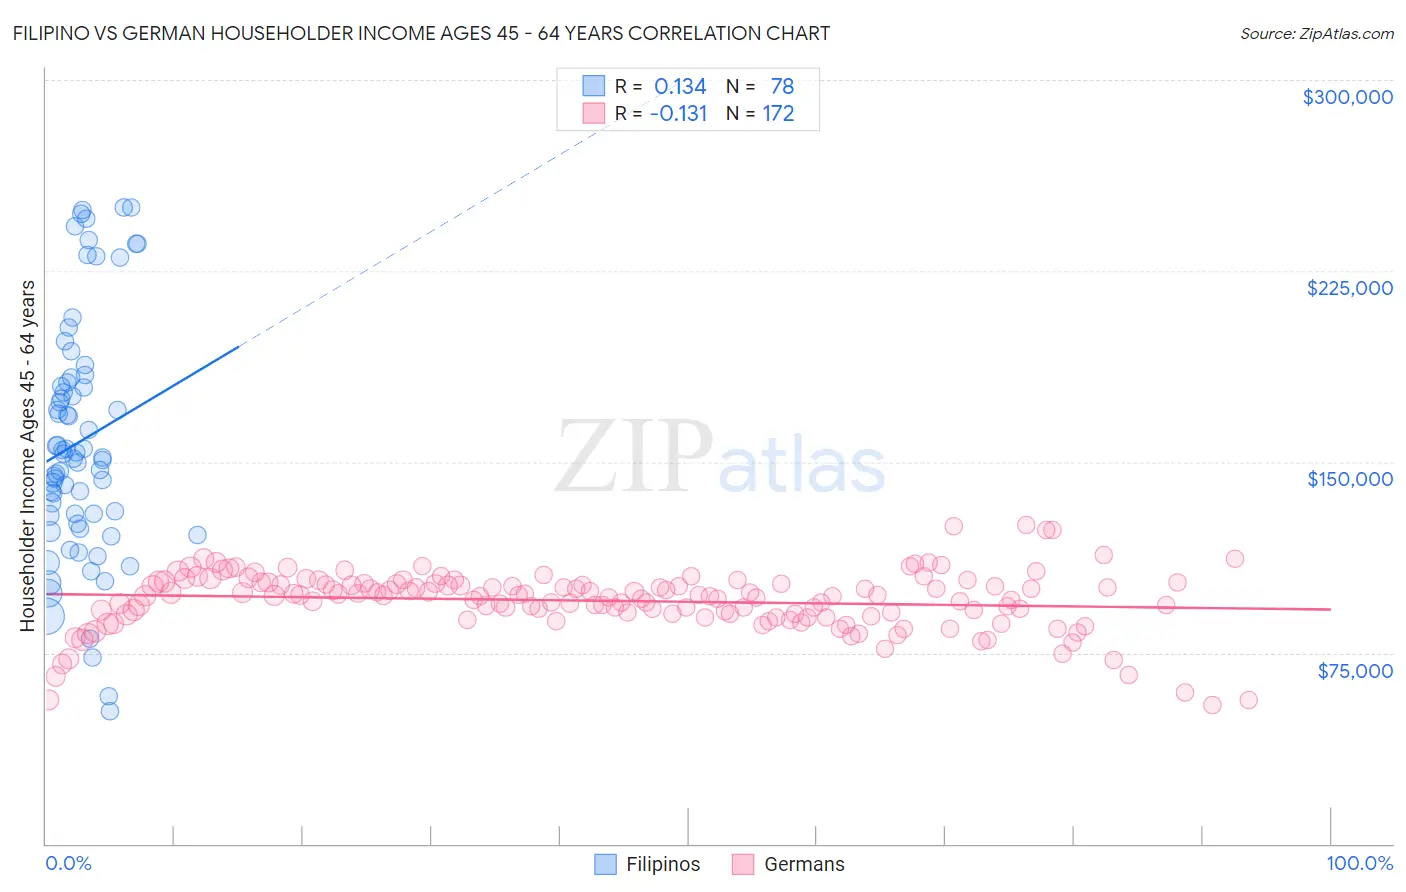
Filipino vs German Householder Income Ages 45 - 64 years Correlation Chart
The statistical analysis conducted on geographies consisting of 254,006,751 people shows a poor positive correlation between the proportion of Filipinos and household income with householder between the ages 45 and 64 in the United States with a correlation coefficient (R) of 0.134 and weighted average of $134,910. Similarly, the statistical analysis conducted on geographies consisting of 575,941,982 people shows a poor negative correlation between the proportion of Germans and household income with householder between the ages 45 and 64 in the United States with a correlation coefficient (R) of -0.131 and weighted average of $100,224, a difference of 34.6%.
Householder Income Ages 45 - 64 years Correlation Summary
| Measurement | Filipino | German |
| Minimum | $51,856 | $54,688 |
| Maximum | $250,001 | $125,293 |
| Range | $198,145 | $70,605 |
| Mean | $158,185 | $95,438 |
| Median | $152,545 | $97,438 |
| Interquartile 25% (IQ1) | $128,904 | $90,029 |
| Interquartile 75% (IQ3) | $181,123 | $102,031 |
| Interquartile Range (IQR) | $52,219 | $12,003 |
| Standard Deviation (Sample) | $46,977 | $11,697 |
| Standard Deviation (Population) | $46,675 | $11,663 |
Similar Demographics by Householder Income Ages 45 - 64 years
Demographics Similar to Filipinos by Householder Income Ages 45 - 64 years
In terms of householder income ages 45 - 64 years, the demographic groups most similar to Filipinos are Immigrants from Taiwan ($135,508, a difference of 0.44%), Immigrants from India ($132,488, a difference of 1.8%), Thai ($129,560, a difference of 4.1%), Immigrants from Singapore ($129,514, a difference of 4.2%), and Iranian ($129,350, a difference of 4.3%).
| Demographics | Rating | Rank | Householder Income Ages 45 - 64 years |
| Immigrants | Taiwan | 100.0 /100 | #1 | Exceptional $135,508 |
| Filipinos | 100.0 /100 | #2 | Exceptional $134,910 |
| Immigrants | India | 100.0 /100 | #3 | Exceptional $132,488 |
| Thais | 100.0 /100 | #4 | Exceptional $129,560 |
| Immigrants | Singapore | 100.0 /100 | #5 | Exceptional $129,514 |
| Iranians | 100.0 /100 | #6 | Exceptional $129,350 |
| Immigrants | Hong Kong | 100.0 /100 | #7 | Exceptional $127,500 |
| Immigrants | Iran | 100.0 /100 | #8 | Exceptional $126,940 |
| Okinawans | 100.0 /100 | #9 | Exceptional $124,796 |
| Immigrants | South Central Asia | 100.0 /100 | #10 | Exceptional $124,188 |
| Cypriots | 100.0 /100 | #11 | Exceptional $123,396 |
| Immigrants | Israel | 100.0 /100 | #12 | Exceptional $122,893 |
| Immigrants | Ireland | 100.0 /100 | #13 | Exceptional $122,757 |
| Indians (Asian) | 100.0 /100 | #14 | Exceptional $122,343 |
| Immigrants | Eastern Asia | 100.0 /100 | #15 | Exceptional $122,222 |
Demographics Similar to Germans by Householder Income Ages 45 - 64 years
In terms of householder income ages 45 - 64 years, the demographic groups most similar to Germans are Immigrants from Costa Rica ($100,141, a difference of 0.080%), Moroccan ($100,138, a difference of 0.090%), Welsh ($100,322, a difference of 0.10%), Immigrants from Cameroon ($100,084, a difference of 0.14%), and Belgian ($100,060, a difference of 0.16%).
| Demographics | Rating | Rank | Householder Income Ages 45 - 64 years |
| South American Indians | 60.5 /100 | #168 | Good $101,171 |
| Guamanians/Chamorros | 60.5 /100 | #169 | Good $101,170 |
| Slovaks | 58.8 /100 | #170 | Average $101,029 |
| South Americans | 56.4 /100 | #171 | Average $100,837 |
| Immigrants | Uzbekistan | 52.5 /100 | #172 | Average $100,523 |
| Alsatians | 51.4 /100 | #173 | Average $100,435 |
| Welsh | 50.0 /100 | #174 | Average $100,322 |
| Germans | 48.8 /100 | #175 | Average $100,224 |
| Immigrants | Costa Rica | 47.7 /100 | #176 | Average $100,141 |
| Moroccans | 47.7 /100 | #177 | Average $100,138 |
| Immigrants | Cameroon | 47.0 /100 | #178 | Average $100,084 |
| Belgians | 46.7 /100 | #179 | Average $100,060 |
| Aleuts | 46.6 /100 | #180 | Average $100,052 |
| Immigrants | Immigrants | 45.3 /100 | #181 | Average $99,943 |
| Finns | 44.8 /100 | #182 | Average $99,904 |