Swiss vs German Householder Income Ages 45 - 64 years
COMPARE
Swiss
German
Householder Income Ages 45 - 64 years
Householder Income Ages 45 - 64 years Comparison
Swiss
Germans
$103,071
HOUSEHOLDER INCOME AGES 45 - 64 YEARS
79.9/ 100
METRIC RATING
151st/ 347
METRIC RANK
$100,224
HOUSEHOLDER INCOME AGES 45 - 64 YEARS
48.8/ 100
METRIC RATING
175th/ 347
METRIC RANK
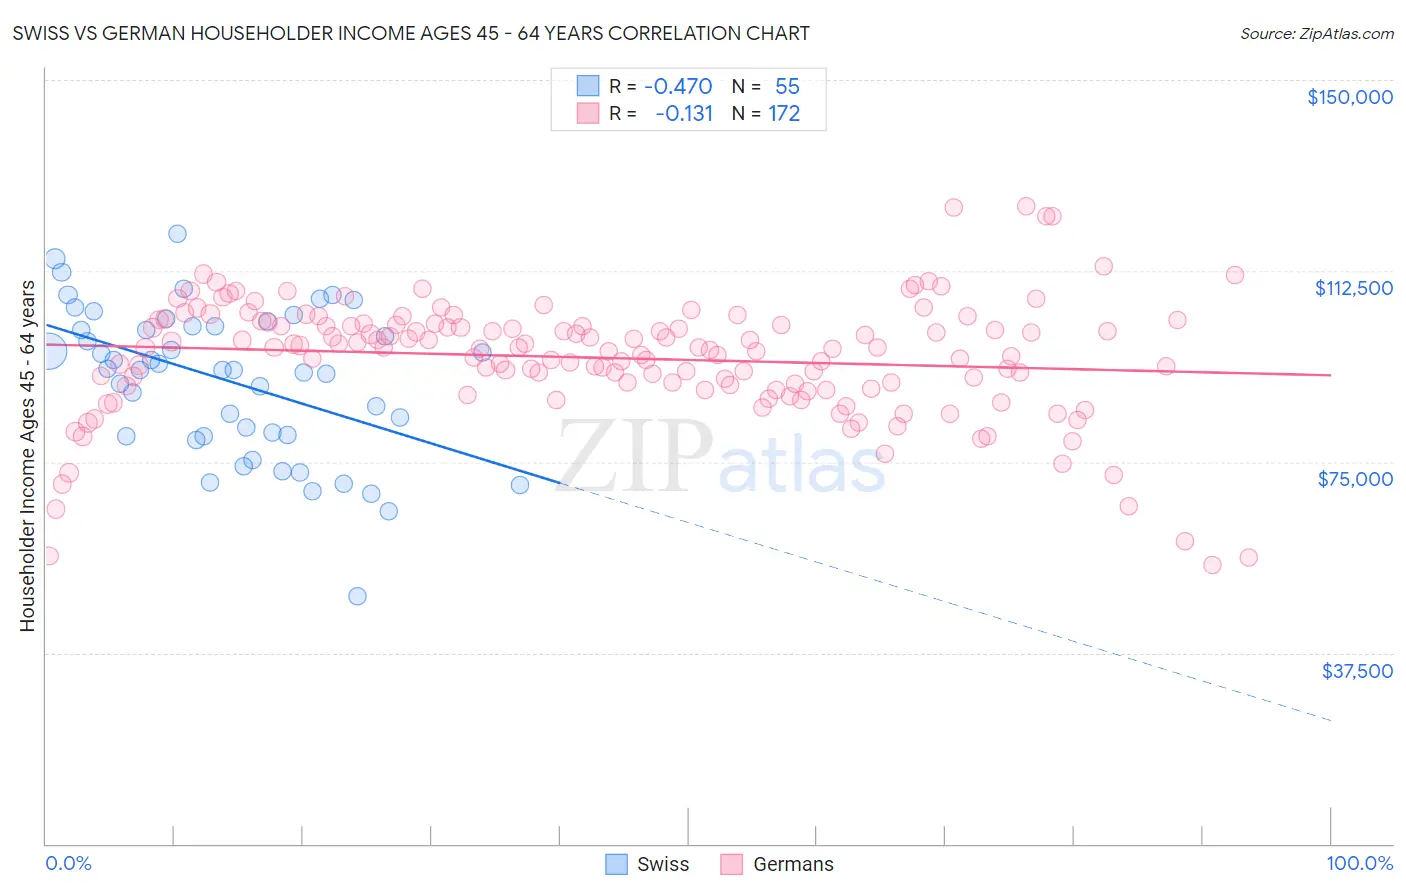
Swiss vs German Householder Income Ages 45 - 64 years Correlation Chart
The statistical analysis conducted on geographies consisting of 463,835,295 people shows a moderate negative correlation between the proportion of Swiss and household income with householder between the ages 45 and 64 in the United States with a correlation coefficient (R) of -0.470 and weighted average of $103,071. Similarly, the statistical analysis conducted on geographies consisting of 575,941,982 people shows a poor negative correlation between the proportion of Germans and household income with householder between the ages 45 and 64 in the United States with a correlation coefficient (R) of -0.131 and weighted average of $100,224, a difference of 2.8%.
Householder Income Ages 45 - 64 years Correlation Summary
| Measurement | Swiss | German |
| Minimum | $48,631 | $54,688 |
| Maximum | $119,830 | $125,293 |
| Range | $71,199 | $70,605 |
| Mean | $90,919 | $95,438 |
| Median | $93,146 | $97,438 |
| Interquartile 25% (IQ1) | $80,104 | $90,029 |
| Interquartile 75% (IQ3) | $101,628 | $102,031 |
| Interquartile Range (IQR) | $21,524 | $12,003 |
| Standard Deviation (Sample) | $14,599 | $11,697 |
| Standard Deviation (Population) | $14,465 | $11,663 |
Similar Demographics by Householder Income Ages 45 - 64 years
Demographics Similar to Swiss by Householder Income Ages 45 - 64 years
In terms of householder income ages 45 - 64 years, the demographic groups most similar to Swiss are Irish ($103,067, a difference of 0.0%), Immigrants from Peru ($103,173, a difference of 0.10%), Scandinavian ($102,969, a difference of 0.10%), Immigrants from Sierra Leone ($103,227, a difference of 0.15%), and Slovene ($102,885, a difference of 0.18%).
| Demographics | Rating | Rank | Householder Income Ages 45 - 64 years |
| Czechs | 83.1 /100 | #144 | Excellent $103,507 |
| Ugandans | 82.9 /100 | #145 | Excellent $103,472 |
| Immigrants | Chile | 82.5 /100 | #146 | Excellent $103,412 |
| Basques | 82.3 /100 | #147 | Excellent $103,387 |
| Immigrants | Germany | 81.5 /100 | #148 | Excellent $103,282 |
| Immigrants | Sierra Leone | 81.1 /100 | #149 | Excellent $103,227 |
| Immigrants | Peru | 80.7 /100 | #150 | Excellent $103,173 |
| Swiss | 79.9 /100 | #151 | Good $103,071 |
| Irish | 79.8 /100 | #152 | Good $103,067 |
| Scandinavians | 79.0 /100 | #153 | Good $102,969 |
| Slovenes | 78.3 /100 | #154 | Good $102,885 |
| Costa Ricans | 77.4 /100 | #155 | Good $102,779 |
| Carpatho Rusyns | 77.4 /100 | #156 | Good $102,777 |
| Immigrants | Ethiopia | 77.3 /100 | #157 | Good $102,763 |
| Slavs | 76.1 /100 | #158 | Good $102,629 |
Demographics Similar to Germans by Householder Income Ages 45 - 64 years
In terms of householder income ages 45 - 64 years, the demographic groups most similar to Germans are Immigrants from Costa Rica ($100,141, a difference of 0.080%), Moroccan ($100,138, a difference of 0.090%), Welsh ($100,322, a difference of 0.10%), Immigrants from Cameroon ($100,084, a difference of 0.14%), and Belgian ($100,060, a difference of 0.16%).
| Demographics | Rating | Rank | Householder Income Ages 45 - 64 years |
| South American Indians | 60.5 /100 | #168 | Good $101,171 |
| Guamanians/Chamorros | 60.5 /100 | #169 | Good $101,170 |
| Slovaks | 58.8 /100 | #170 | Average $101,029 |
| South Americans | 56.4 /100 | #171 | Average $100,837 |
| Immigrants | Uzbekistan | 52.5 /100 | #172 | Average $100,523 |
| Alsatians | 51.4 /100 | #173 | Average $100,435 |
| Welsh | 50.0 /100 | #174 | Average $100,322 |
| Germans | 48.8 /100 | #175 | Average $100,224 |
| Immigrants | Costa Rica | 47.7 /100 | #176 | Average $100,141 |
| Moroccans | 47.7 /100 | #177 | Average $100,138 |
| Immigrants | Cameroon | 47.0 /100 | #178 | Average $100,084 |
| Belgians | 46.7 /100 | #179 | Average $100,060 |
| Aleuts | 46.6 /100 | #180 | Average $100,052 |
| Immigrants | Immigrants | 45.3 /100 | #181 | Average $99,943 |
| Finns | 44.8 /100 | #182 | Average $99,904 |