Immigrants from Middle Africa vs German Householder Income Ages 45 - 64 years
COMPARE
Immigrants from Middle Africa
German
Householder Income Ages 45 - 64 years
Householder Income Ages 45 - 64 years Comparison
Immigrants from Middle Africa
Germans
$91,293
HOUSEHOLDER INCOME AGES 45 - 64 YEARS
1.1/ 100
METRIC RATING
244th/ 347
METRIC RANK
$100,224
HOUSEHOLDER INCOME AGES 45 - 64 YEARS
48.8/ 100
METRIC RATING
175th/ 347
METRIC RANK
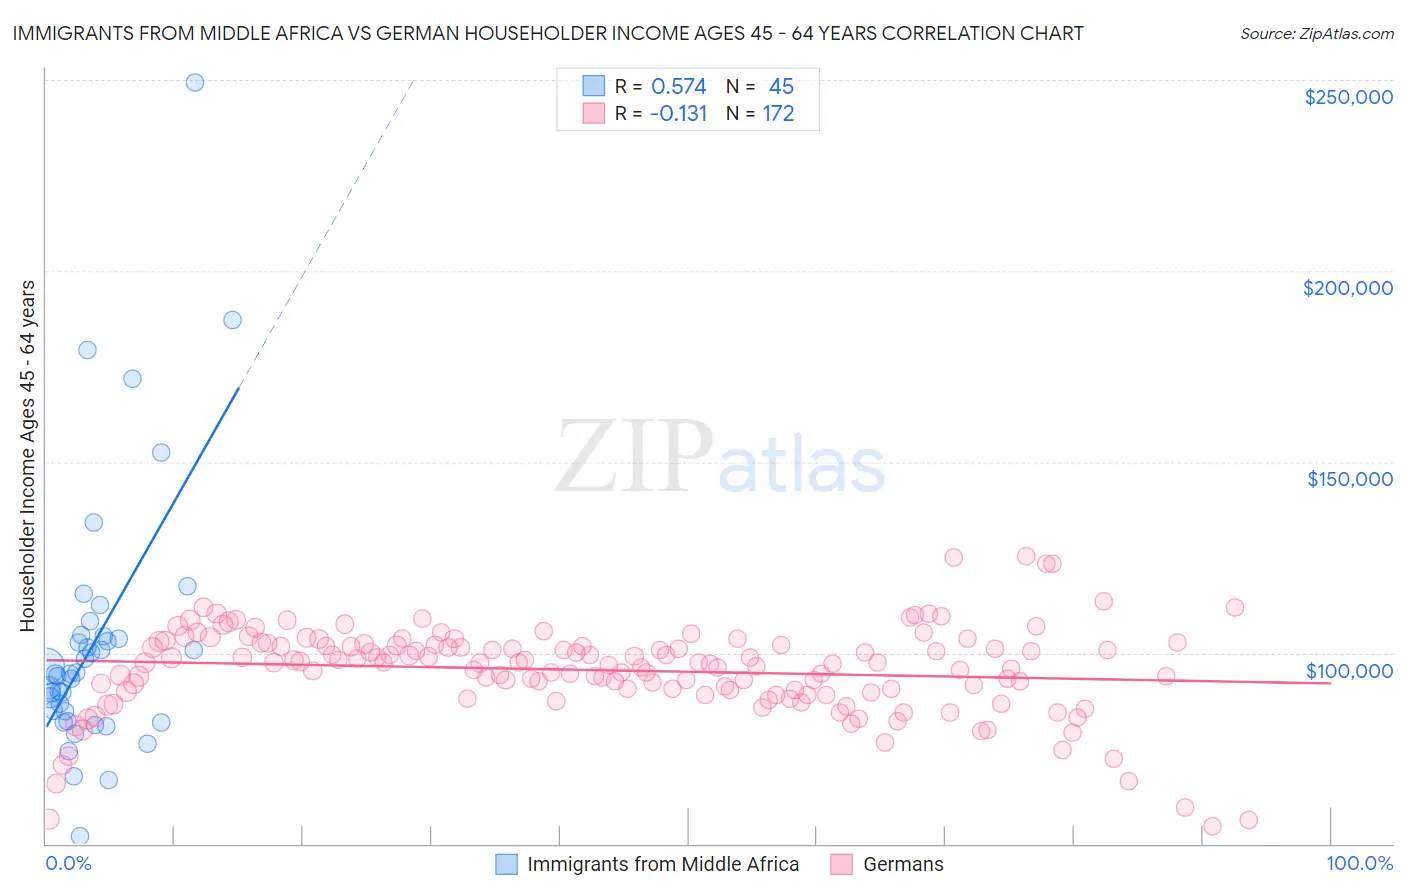
Immigrants from Middle Africa vs German Householder Income Ages 45 - 64 years Correlation Chart
The statistical analysis conducted on geographies consisting of 202,576,362 people shows a substantial positive correlation between the proportion of Immigrants from Middle Africa and household income with householder between the ages 45 and 64 in the United States with a correlation coefficient (R) of 0.574 and weighted average of $91,293. Similarly, the statistical analysis conducted on geographies consisting of 575,941,982 people shows a poor negative correlation between the proportion of Germans and household income with householder between the ages 45 and 64 in the United States with a correlation coefficient (R) of -0.131 and weighted average of $100,224, a difference of 9.8%.
Householder Income Ages 45 - 64 years Correlation Summary
| Measurement | Immigrants from Middle Africa | German |
| Minimum | $51,937 | $54,688 |
| Maximum | $249,250 | $125,293 |
| Range | $197,313 | $70,605 |
| Mean | $103,154 | $95,438 |
| Median | $94,432 | $97,438 |
| Interquartile 25% (IQ1) | $83,489 | $90,029 |
| Interquartile 75% (IQ3) | $104,529 | $102,031 |
| Interquartile Range (IQR) | $21,040 | $12,003 |
| Standard Deviation (Sample) | $35,287 | $11,697 |
| Standard Deviation (Population) | $34,892 | $11,663 |
Similar Demographics by Householder Income Ages 45 - 64 years
Demographics Similar to Immigrants from Middle Africa by Householder Income Ages 45 - 64 years
In terms of householder income ages 45 - 64 years, the demographic groups most similar to Immigrants from Middle Africa are Immigrants from Trinidad and Tobago ($91,347, a difference of 0.060%), Trinidadian and Tobagonian ($91,357, a difference of 0.070%), Inupiat ($91,355, a difference of 0.070%), Immigrants from Burma/Myanmar ($91,385, a difference of 0.10%), and Immigrants from Ecuador ($91,462, a difference of 0.19%).
| Demographics | Rating | Rank | Householder Income Ages 45 - 64 years |
| Immigrants | Bangladesh | 1.7 /100 | #237 | Tragic $92,208 |
| Pennsylvania Germans | 1.5 /100 | #238 | Tragic $91,956 |
| Immigrants | Ecuador | 1.2 /100 | #239 | Tragic $91,462 |
| Immigrants | Burma/Myanmar | 1.1 /100 | #240 | Tragic $91,385 |
| Trinidadians and Tobagonians | 1.1 /100 | #241 | Tragic $91,357 |
| Inupiat | 1.1 /100 | #242 | Tragic $91,355 |
| Immigrants | Trinidad and Tobago | 1.1 /100 | #243 | Tragic $91,347 |
| Immigrants | Middle Africa | 1.1 /100 | #244 | Tragic $91,293 |
| Guyanese | 0.9 /100 | #245 | Tragic $90,966 |
| Central Americans | 0.9 /100 | #246 | Tragic $90,951 |
| Alaskan Athabascans | 0.9 /100 | #247 | Tragic $90,951 |
| Immigrants | Laos | 0.9 /100 | #248 | Tragic $90,909 |
| Mexican American Indians | 0.8 /100 | #249 | Tragic $90,811 |
| Sub-Saharan Africans | 0.8 /100 | #250 | Tragic $90,691 |
| Americans | 0.7 /100 | #251 | Tragic $90,536 |
Demographics Similar to Germans by Householder Income Ages 45 - 64 years
In terms of householder income ages 45 - 64 years, the demographic groups most similar to Germans are Immigrants from Costa Rica ($100,141, a difference of 0.080%), Moroccan ($100,138, a difference of 0.090%), Welsh ($100,322, a difference of 0.10%), Immigrants from Cameroon ($100,084, a difference of 0.14%), and Belgian ($100,060, a difference of 0.16%).
| Demographics | Rating | Rank | Householder Income Ages 45 - 64 years |
| South American Indians | 60.5 /100 | #168 | Good $101,171 |
| Guamanians/Chamorros | 60.5 /100 | #169 | Good $101,170 |
| Slovaks | 58.8 /100 | #170 | Average $101,029 |
| South Americans | 56.4 /100 | #171 | Average $100,837 |
| Immigrants | Uzbekistan | 52.5 /100 | #172 | Average $100,523 |
| Alsatians | 51.4 /100 | #173 | Average $100,435 |
| Welsh | 50.0 /100 | #174 | Average $100,322 |
| Germans | 48.8 /100 | #175 | Average $100,224 |
| Immigrants | Costa Rica | 47.7 /100 | #176 | Average $100,141 |
| Moroccans | 47.7 /100 | #177 | Average $100,138 |
| Immigrants | Cameroon | 47.0 /100 | #178 | Average $100,084 |
| Belgians | 46.7 /100 | #179 | Average $100,060 |
| Aleuts | 46.6 /100 | #180 | Average $100,052 |
| Immigrants | Immigrants | 45.3 /100 | #181 | Average $99,943 |
| Finns | 44.8 /100 | #182 | Average $99,904 |