Slavic vs Norwegian Householder Income Ages 45 - 64 years
COMPARE
Slavic
Norwegian
Householder Income Ages 45 - 64 years
Householder Income Ages 45 - 64 years Comparison
Slavs
Norwegians
$102,629
HOUSEHOLDER INCOME AGES 45 - 64 YEARS
76.1/ 100
METRIC RATING
158th/ 347
METRIC RANK
$103,682
HOUSEHOLDER INCOME AGES 45 - 64 YEARS
84.3/ 100
METRIC RATING
140th/ 347
METRIC RANK
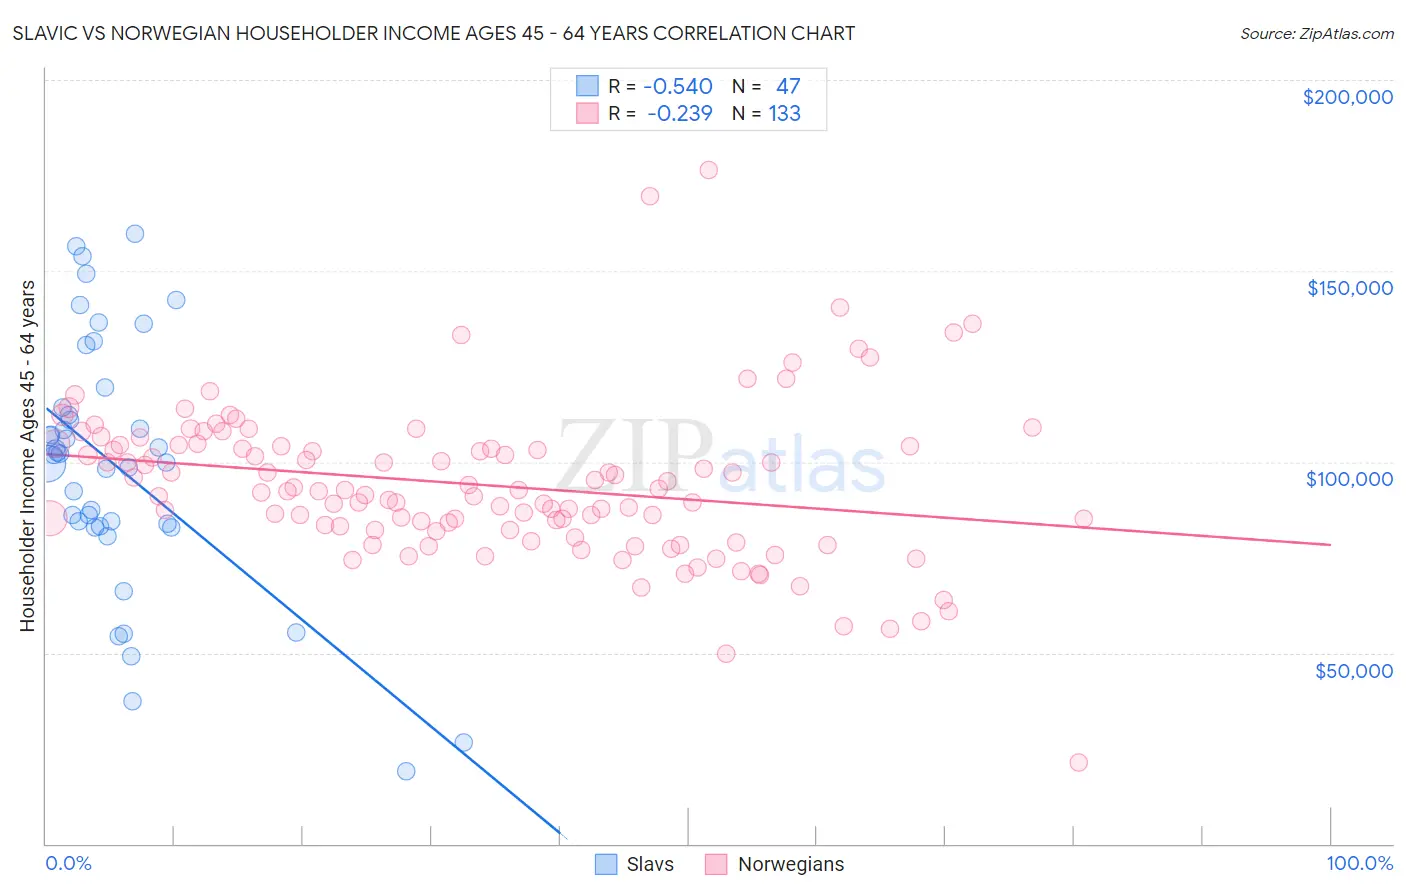
Slavic vs Norwegian Householder Income Ages 45 - 64 years Correlation Chart
The statistical analysis conducted on geographies consisting of 270,616,686 people shows a substantial negative correlation between the proportion of Slavs and household income with householder between the ages 45 and 64 in the United States with a correlation coefficient (R) of -0.540 and weighted average of $102,629. Similarly, the statistical analysis conducted on geographies consisting of 530,964,543 people shows a weak negative correlation between the proportion of Norwegians and household income with householder between the ages 45 and 64 in the United States with a correlation coefficient (R) of -0.239 and weighted average of $103,682, a difference of 1.0%.
Householder Income Ages 45 - 64 years Correlation Summary
| Measurement | Slavic | Norwegian |
| Minimum | $18,979 | $21,250 |
| Maximum | $159,583 | $176,301 |
| Range | $140,604 | $155,051 |
| Mean | $98,663 | $93,934 |
| Median | $101,881 | $92,185 |
| Interquartile 25% (IQ1) | $83,250 | $82,157 |
| Interquartile 75% (IQ3) | $114,292 | $104,273 |
| Interquartile Range (IQR) | $31,042 | $22,116 |
| Standard Deviation (Sample) | $32,811 | $20,569 |
| Standard Deviation (Population) | $32,460 | $20,492 |
Demographics Similar to Slavs and Norwegians by Householder Income Ages 45 - 64 years
In terms of householder income ages 45 - 64 years, the demographic groups most similar to Slavs are Immigrants from Ethiopia ($102,763, a difference of 0.13%), Carpatho Rusyn ($102,777, a difference of 0.14%), Costa Rican ($102,779, a difference of 0.15%), Sierra Leonean ($102,427, a difference of 0.20%), and Slovene ($102,885, a difference of 0.25%). Similarly, the demographic groups most similar to Norwegians are Immigrants from Oceania ($103,705, a difference of 0.020%), Immigrants from Uganda ($103,584, a difference of 0.090%), Luxembourger ($103,536, a difference of 0.14%), Serbian ($103,522, a difference of 0.15%), and Czech ($103,507, a difference of 0.17%).
| Demographics | Rating | Rank | Householder Income Ages 45 - 64 years |
| Immigrants | Oceania | 84.5 /100 | #139 | Excellent $103,705 |
| Norwegians | 84.3 /100 | #140 | Excellent $103,682 |
| Immigrants | Uganda | 83.7 /100 | #141 | Excellent $103,584 |
| Luxembourgers | 83.3 /100 | #142 | Excellent $103,536 |
| Serbians | 83.2 /100 | #143 | Excellent $103,522 |
| Czechs | 83.1 /100 | #144 | Excellent $103,507 |
| Ugandans | 82.9 /100 | #145 | Excellent $103,472 |
| Immigrants | Chile | 82.5 /100 | #146 | Excellent $103,412 |
| Basques | 82.3 /100 | #147 | Excellent $103,387 |
| Immigrants | Germany | 81.5 /100 | #148 | Excellent $103,282 |
| Immigrants | Sierra Leone | 81.1 /100 | #149 | Excellent $103,227 |
| Immigrants | Peru | 80.7 /100 | #150 | Excellent $103,173 |
| Swiss | 79.9 /100 | #151 | Good $103,071 |
| Irish | 79.8 /100 | #152 | Good $103,067 |
| Scandinavians | 79.0 /100 | #153 | Good $102,969 |
| Slovenes | 78.3 /100 | #154 | Good $102,885 |
| Costa Ricans | 77.4 /100 | #155 | Good $102,779 |
| Carpatho Rusyns | 77.4 /100 | #156 | Good $102,777 |
| Immigrants | Ethiopia | 77.3 /100 | #157 | Good $102,763 |
| Slavs | 76.1 /100 | #158 | Good $102,629 |
| Sierra Leoneans | 74.2 /100 | #159 | Good $102,427 |