Slavic vs Immigrants from Cambodia Householder Income Ages 45 - 64 years
COMPARE
Slavic
Immigrants from Cambodia
Householder Income Ages 45 - 64 years
Householder Income Ages 45 - 64 years Comparison
Slavs
Immigrants from Cambodia
$102,629
HOUSEHOLDER INCOME AGES 45 - 64 YEARS
76.1/ 100
METRIC RATING
158th/ 347
METRIC RANK
$96,537
HOUSEHOLDER INCOME AGES 45 - 64 YEARS
13.0/ 100
METRIC RATING
211th/ 347
METRIC RANK
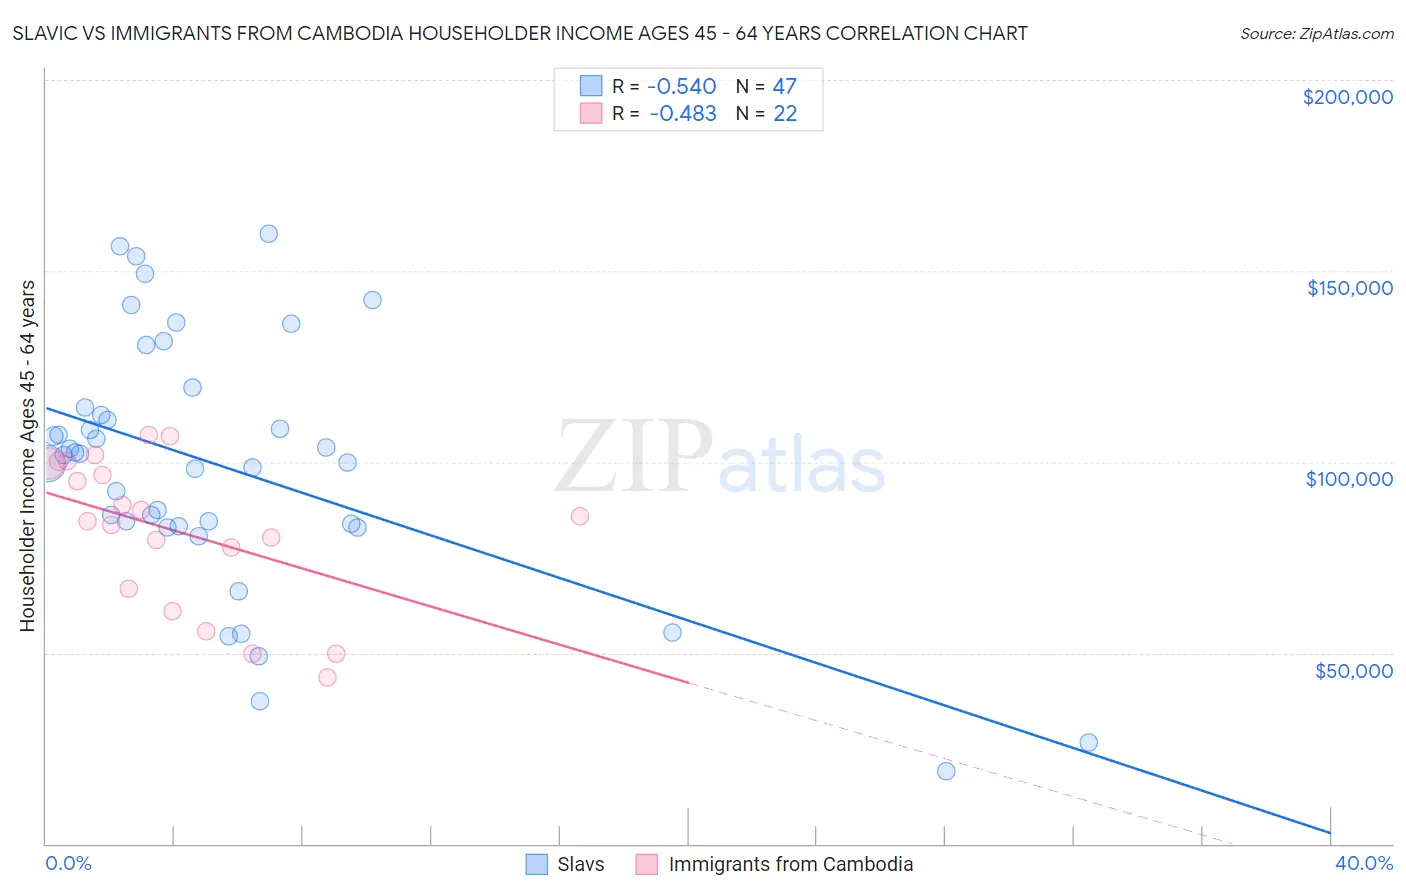
Slavic vs Immigrants from Cambodia Householder Income Ages 45 - 64 years Correlation Chart
The statistical analysis conducted on geographies consisting of 270,616,686 people shows a substantial negative correlation between the proportion of Slavs and household income with householder between the ages 45 and 64 in the United States with a correlation coefficient (R) of -0.540 and weighted average of $102,629. Similarly, the statistical analysis conducted on geographies consisting of 205,043,738 people shows a moderate negative correlation between the proportion of Immigrants from Cambodia and household income with householder between the ages 45 and 64 in the United States with a correlation coefficient (R) of -0.483 and weighted average of $96,537, a difference of 6.3%.
Householder Income Ages 45 - 64 years Correlation Summary
| Measurement | Slavic | Immigrants from Cambodia |
| Minimum | $18,979 | $43,614 |
| Maximum | $159,583 | $107,055 |
| Range | $140,604 | $63,441 |
| Mean | $98,663 | $81,812 |
| Median | $101,881 | $85,046 |
| Interquartile 25% (IQ1) | $83,250 | $66,651 |
| Interquartile 75% (IQ3) | $114,292 | $99,554 |
| Interquartile Range (IQR) | $31,042 | $32,903 |
| Standard Deviation (Sample) | $32,811 | $19,590 |
| Standard Deviation (Population) | $32,460 | $19,140 |
Similar Demographics by Householder Income Ages 45 - 64 years
Demographics Similar to Slavs by Householder Income Ages 45 - 64 years
In terms of householder income ages 45 - 64 years, the demographic groups most similar to Slavs are Immigrants from Ethiopia ($102,763, a difference of 0.13%), Carpatho Rusyn ($102,777, a difference of 0.14%), Costa Rican ($102,779, a difference of 0.15%), Sierra Leonean ($102,427, a difference of 0.20%), and Slovene ($102,885, a difference of 0.25%).
| Demographics | Rating | Rank | Householder Income Ages 45 - 64 years |
| Swiss | 79.9 /100 | #151 | Good $103,071 |
| Irish | 79.8 /100 | #152 | Good $103,067 |
| Scandinavians | 79.0 /100 | #153 | Good $102,969 |
| Slovenes | 78.3 /100 | #154 | Good $102,885 |
| Costa Ricans | 77.4 /100 | #155 | Good $102,779 |
| Carpatho Rusyns | 77.4 /100 | #156 | Good $102,777 |
| Immigrants | Ethiopia | 77.3 /100 | #157 | Good $102,763 |
| Slavs | 76.1 /100 | #158 | Good $102,629 |
| Sierra Leoneans | 74.2 /100 | #159 | Good $102,427 |
| Icelanders | 72.5 /100 | #160 | Good $102,261 |
| Immigrants | Nepal | 71.8 /100 | #161 | Good $102,190 |
| Scottish | 71.1 /100 | #162 | Good $102,123 |
| English | 70.1 /100 | #163 | Good $102,021 |
| Immigrants | Morocco | 70.0 /100 | #164 | Good $102,015 |
| Immigrants | Albania | 69.4 /100 | #165 | Good $101,957 |
Demographics Similar to Immigrants from Cambodia by Householder Income Ages 45 - 64 years
In terms of householder income ages 45 - 64 years, the demographic groups most similar to Immigrants from Cambodia are Venezuelan ($96,460, a difference of 0.080%), Tsimshian ($96,783, a difference of 0.26%), Japanese ($96,834, a difference of 0.31%), Immigrants from Uruguay ($96,086, a difference of 0.47%), and Panamanian ($96,066, a difference of 0.49%).
| Demographics | Rating | Rank | Householder Income Ages 45 - 64 years |
| Immigrants | Eritrea | 18.6 /100 | #204 | Poor $97,373 |
| Immigrants | Colombia | 18.0 /100 | #205 | Poor $97,290 |
| Immigrants | Africa | 17.9 /100 | #206 | Poor $97,284 |
| Ghanaians | 17.9 /100 | #207 | Poor $97,277 |
| Scotch-Irish | 16.4 /100 | #208 | Poor $97,073 |
| Japanese | 14.8 /100 | #209 | Poor $96,834 |
| Tsimshian | 14.5 /100 | #210 | Poor $96,783 |
| Immigrants | Cambodia | 13.0 /100 | #211 | Poor $96,537 |
| Venezuelans | 12.6 /100 | #212 | Poor $96,460 |
| Immigrants | Uruguay | 10.7 /100 | #213 | Poor $96,086 |
| Panamanians | 10.6 /100 | #214 | Poor $96,066 |
| Nigerians | 8.2 /100 | #215 | Tragic $95,492 |
| Immigrants | Venezuela | 7.6 /100 | #216 | Tragic $95,342 |
| Immigrants | Ghana | 6.4 /100 | #217 | Tragic $94,982 |
| Delaware | 6.2 /100 | #218 | Tragic $94,914 |