Immigrants from Singapore vs Croatian Median Household Income
COMPARE
Immigrants from Singapore
Croatian
Median Household Income
Median Household Income Comparison
Immigrants from Singapore
Croatians
$110,428
MEDIAN HOUSEHOLD INCOME
100.0/ 100
METRIC RATING
6th/ 347
METRIC RANK
$90,685
MEDIAN HOUSEHOLD INCOME
97.3/ 100
METRIC RATING
107th/ 347
METRIC RANK
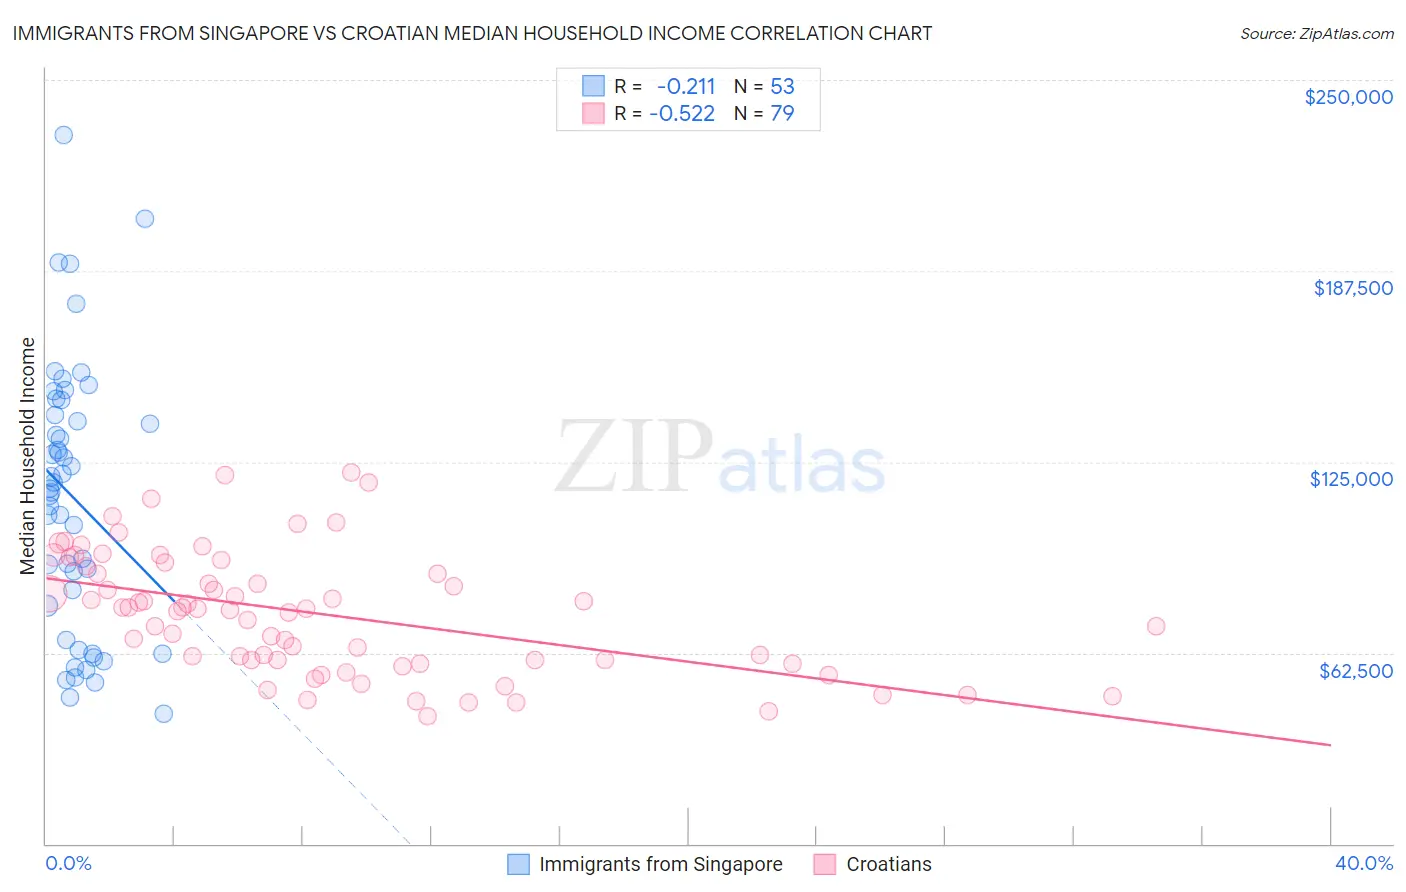
Immigrants from Singapore vs Croatian Median Household Income Correlation Chart
The statistical analysis conducted on geographies consisting of 137,415,639 people shows a weak negative correlation between the proportion of Immigrants from Singapore and median household income in the United States with a correlation coefficient (R) of -0.211 and weighted average of $110,428. Similarly, the statistical analysis conducted on geographies consisting of 375,471,157 people shows a substantial negative correlation between the proportion of Croatians and median household income in the United States with a correlation coefficient (R) of -0.522 and weighted average of $90,685, a difference of 21.8%.
Median Household Income Correlation Summary
| Measurement | Immigrants from Singapore | Croatian |
| Minimum | $42,500 | $41,696 |
| Maximum | $232,046 | $121,425 |
| Range | $189,546 | $79,729 |
| Mean | $113,253 | $75,345 |
| Median | $116,276 | $76,836 |
| Interquartile 25% (IQ1) | $72,208 | $59,949 |
| Interquartile 75% (IQ3) | $142,877 | $91,012 |
| Interquartile Range (IQR) | $70,669 | $31,063 |
| Standard Deviation (Sample) | $43,740 | $19,789 |
| Standard Deviation (Population) | $43,325 | $19,663 |
Similar Demographics by Median Household Income
Demographics Similar to Immigrants from Singapore by Median Household Income
In terms of median household income, the demographic groups most similar to Immigrants from Singapore are Thai ($110,648, a difference of 0.20%), Iranian ($109,835, a difference of 0.54%), Immigrants from Hong Kong ($111,519, a difference of 0.99%), Immigrants from Iran ($108,055, a difference of 2.2%), and Immigrants from India ($113,009, a difference of 2.3%).
| Demographics | Rating | Rank | Median Household Income |
| Immigrants | Taiwan | 100.0 /100 | #1 | Exceptional $116,460 |
| Filipinos | 100.0 /100 | #2 | Exceptional $115,509 |
| Immigrants | India | 100.0 /100 | #3 | Exceptional $113,009 |
| Immigrants | Hong Kong | 100.0 /100 | #4 | Exceptional $111,519 |
| Thais | 100.0 /100 | #5 | Exceptional $110,648 |
| Immigrants | Singapore | 100.0 /100 | #6 | Exceptional $110,428 |
| Iranians | 100.0 /100 | #7 | Exceptional $109,835 |
| Immigrants | Iran | 100.0 /100 | #8 | Exceptional $108,055 |
| Okinawans | 100.0 /100 | #9 | Exceptional $106,624 |
| Immigrants | South Central Asia | 100.0 /100 | #10 | Exceptional $106,057 |
| Immigrants | China | 100.0 /100 | #11 | Exceptional $105,335 |
| Indians (Asian) | 100.0 /100 | #12 | Exceptional $105,262 |
| Immigrants | Eastern Asia | 100.0 /100 | #13 | Exceptional $104,796 |
| Immigrants | Ireland | 100.0 /100 | #14 | Exceptional $104,692 |
| Immigrants | Israel | 100.0 /100 | #15 | Exceptional $104,090 |
Demographics Similar to Croatians by Median Household Income
In terms of median household income, the demographic groups most similar to Croatians are Zimbabwean ($90,618, a difference of 0.070%), Macedonian ($90,761, a difference of 0.080%), Chilean ($90,605, a difference of 0.090%), Palestinian ($90,574, a difference of 0.12%), and Immigrants from Poland ($90,549, a difference of 0.15%).
| Demographics | Rating | Rank | Median Household Income |
| Ukrainians | 98.3 /100 | #100 | Exceptional $91,456 |
| Immigrants | Moldova | 98.3 /100 | #101 | Exceptional $91,446 |
| Austrians | 98.2 /100 | #102 | Exceptional $91,339 |
| Immigrants | Ukraine | 98.0 /100 | #103 | Exceptional $91,124 |
| Immigrants | Kazakhstan | 97.8 /100 | #104 | Exceptional $91,015 |
| Immigrants | Brazil | 97.7 /100 | #105 | Exceptional $90,907 |
| Macedonians | 97.4 /100 | #106 | Exceptional $90,761 |
| Croatians | 97.3 /100 | #107 | Exceptional $90,685 |
| Zimbabweans | 97.2 /100 | #108 | Exceptional $90,618 |
| Chileans | 97.2 /100 | #109 | Exceptional $90,605 |
| Palestinians | 97.1 /100 | #110 | Exceptional $90,574 |
| Immigrants | Poland | 97.1 /100 | #111 | Exceptional $90,549 |
| Northern Europeans | 96.9 /100 | #112 | Exceptional $90,446 |
| Peruvians | 96.5 /100 | #113 | Exceptional $90,261 |
| Immigrants | Northern Africa | 95.9 /100 | #114 | Exceptional $90,026 |