Paiute vs Croatian Median Household Income
COMPARE
Paiute
Croatian
Median Household Income
Median Household Income Comparison
Paiute
Croatians
$72,959
MEDIAN HOUSEHOLD INCOME
0.0/ 100
METRIC RATING
298th/ 347
METRIC RANK
$90,685
MEDIAN HOUSEHOLD INCOME
97.3/ 100
METRIC RATING
107th/ 347
METRIC RANK
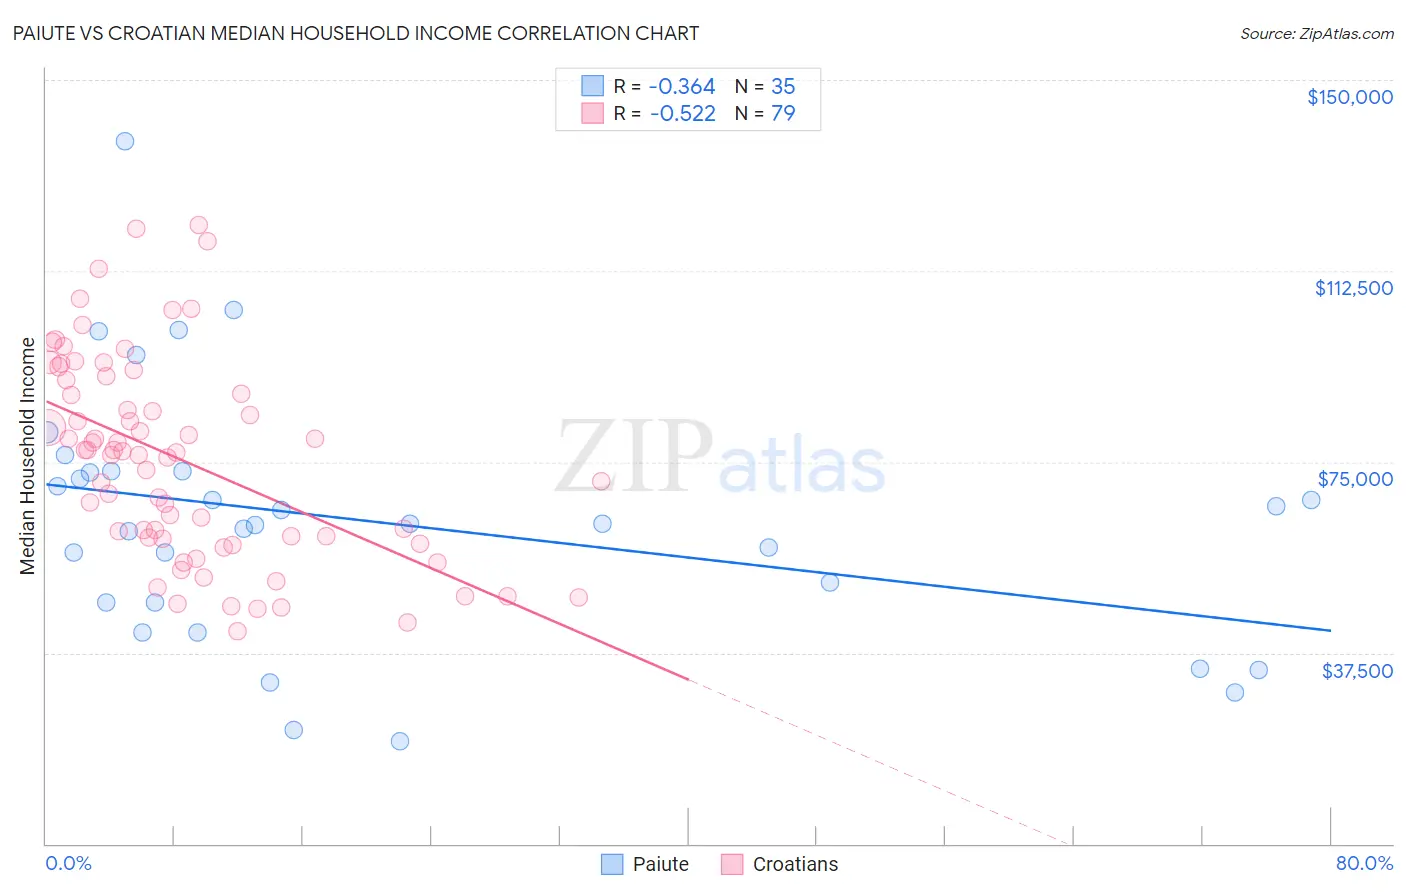
Paiute vs Croatian Median Household Income Correlation Chart
The statistical analysis conducted on geographies consisting of 58,395,139 people shows a mild negative correlation between the proportion of Paiute and median household income in the United States with a correlation coefficient (R) of -0.364 and weighted average of $72,959. Similarly, the statistical analysis conducted on geographies consisting of 375,471,157 people shows a substantial negative correlation between the proportion of Croatians and median household income in the United States with a correlation coefficient (R) of -0.522 and weighted average of $90,685, a difference of 24.3%.
Median Household Income Correlation Summary
| Measurement | Paiute | Croatian |
| Minimum | $20,139 | $41,696 |
| Maximum | $138,043 | $121,425 |
| Range | $117,904 | $79,729 |
| Mean | $63,163 | $75,345 |
| Median | $62,760 | $76,836 |
| Interquartile 25% (IQ1) | $47,361 | $59,949 |
| Interquartile 75% (IQ3) | $73,101 | $91,012 |
| Interquartile Range (IQR) | $25,740 | $31,063 |
| Standard Deviation (Sample) | $24,968 | $19,789 |
| Standard Deviation (Population) | $24,608 | $19,663 |
Similar Demographics by Median Household Income
Demographics Similar to Paiute by Median Household Income
In terms of median household income, the demographic groups most similar to Paiute are Indonesian ($72,856, a difference of 0.14%), Immigrants from Mexico ($73,160, a difference of 0.27%), Immigrants from Dominica ($72,760, a difference of 0.27%), Cherokee ($72,682, a difference of 0.38%), and Shoshone ($72,660, a difference of 0.41%).
| Demographics | Rating | Rank | Median Household Income |
| Hispanics or Latinos | 0.1 /100 | #291 | Tragic $73,823 |
| Comanche | 0.1 /100 | #292 | Tragic $73,747 |
| Immigrants | Cabo Verde | 0.1 /100 | #293 | Tragic $73,515 |
| Blackfeet | 0.1 /100 | #294 | Tragic $73,509 |
| Cubans | 0.1 /100 | #295 | Tragic $73,392 |
| Haitians | 0.1 /100 | #296 | Tragic $73,306 |
| Immigrants | Mexico | 0.0 /100 | #297 | Tragic $73,160 |
| Paiute | 0.0 /100 | #298 | Tragic $72,959 |
| Indonesians | 0.0 /100 | #299 | Tragic $72,856 |
| Immigrants | Dominica | 0.0 /100 | #300 | Tragic $72,760 |
| Cherokee | 0.0 /100 | #301 | Tragic $72,682 |
| Shoshone | 0.0 /100 | #302 | Tragic $72,660 |
| Africans | 0.0 /100 | #303 | Tragic $72,650 |
| Immigrants | Haiti | 0.0 /100 | #304 | Tragic $72,599 |
| Hondurans | 0.0 /100 | #305 | Tragic $72,588 |
Demographics Similar to Croatians by Median Household Income
In terms of median household income, the demographic groups most similar to Croatians are Zimbabwean ($90,618, a difference of 0.070%), Macedonian ($90,761, a difference of 0.080%), Chilean ($90,605, a difference of 0.090%), Palestinian ($90,574, a difference of 0.12%), and Immigrants from Poland ($90,549, a difference of 0.15%).
| Demographics | Rating | Rank | Median Household Income |
| Ukrainians | 98.3 /100 | #100 | Exceptional $91,456 |
| Immigrants | Moldova | 98.3 /100 | #101 | Exceptional $91,446 |
| Austrians | 98.2 /100 | #102 | Exceptional $91,339 |
| Immigrants | Ukraine | 98.0 /100 | #103 | Exceptional $91,124 |
| Immigrants | Kazakhstan | 97.8 /100 | #104 | Exceptional $91,015 |
| Immigrants | Brazil | 97.7 /100 | #105 | Exceptional $90,907 |
| Macedonians | 97.4 /100 | #106 | Exceptional $90,761 |
| Croatians | 97.3 /100 | #107 | Exceptional $90,685 |
| Zimbabweans | 97.2 /100 | #108 | Exceptional $90,618 |
| Chileans | 97.2 /100 | #109 | Exceptional $90,605 |
| Palestinians | 97.1 /100 | #110 | Exceptional $90,574 |
| Immigrants | Poland | 97.1 /100 | #111 | Exceptional $90,549 |
| Northern Europeans | 96.9 /100 | #112 | Exceptional $90,446 |
| Peruvians | 96.5 /100 | #113 | Exceptional $90,261 |
| Immigrants | Northern Africa | 95.9 /100 | #114 | Exceptional $90,026 |