Slavic vs Croatian Currently Married
COMPARE
Slavic
Croatian
Currently Married
Currently Married Comparison
Slavs
Croatians
48.4%
CURRENTLY MARRIED
98.3/ 100
METRIC RATING
63rd/ 347
METRIC RANK
48.9%
CURRENTLY MARRIED
99.5/ 100
METRIC RATING
29th/ 347
METRIC RANK
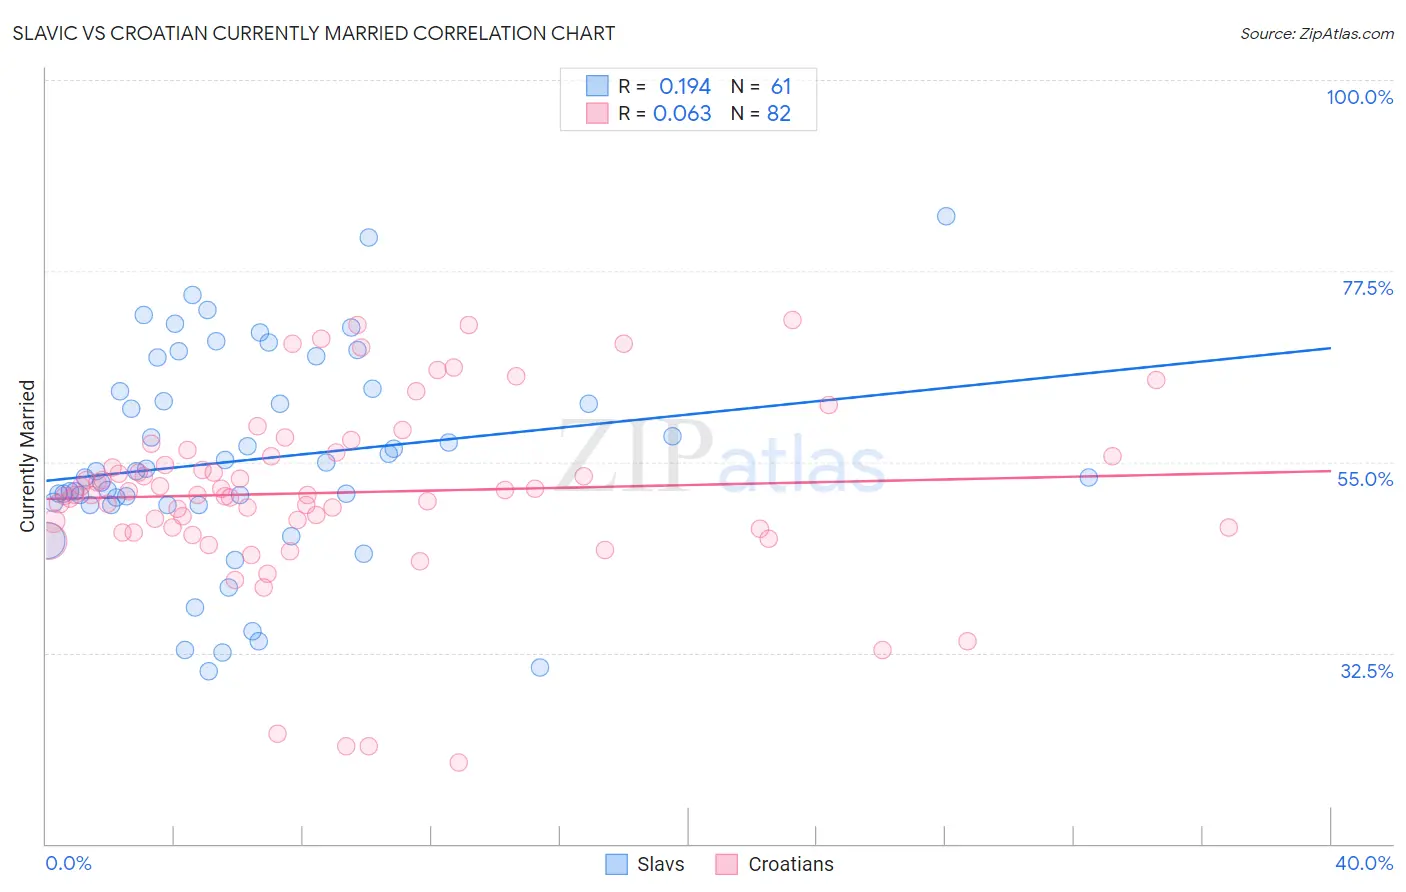
Slavic vs Croatian Currently Married Correlation Chart
The statistical analysis conducted on geographies consisting of 270,868,948 people shows a poor positive correlation between the proportion of Slavs and percentage of population currently married in the United States with a correlation coefficient (R) of 0.194 and weighted average of 48.4%. Similarly, the statistical analysis conducted on geographies consisting of 375,687,747 people shows a slight positive correlation between the proportion of Croatians and percentage of population currently married in the United States with a correlation coefficient (R) of 0.063 and weighted average of 48.9%, a difference of 1.1%.
Currently Married Correlation Summary
| Measurement | Slavic | Croatian |
| Minimum | 30.3% | 19.6% |
| Maximum | 84.0% | 71.7% |
| Range | 53.7% | 52.1% |
| Mean | 55.2% | 51.4% |
| Median | 53.9% | 51.1% |
| Interquartile 25% (IQ1) | 50.0% | 47.2% |
| Interquartile 75% (IQ3) | 63.5% | 55.7% |
| Interquartile Range (IQR) | 13.6% | 8.5% |
| Standard Deviation (Sample) | 12.2% | 10.5% |
| Standard Deviation (Population) | 12.1% | 10.4% |
Similar Demographics by Currently Married
Demographics Similar to Slavs by Currently Married
In terms of currently married, the demographic groups most similar to Slavs are Immigrants from Czechoslovakia (48.4%, a difference of 0.0%), Ukrainian (48.4%, a difference of 0.010%), Tongan (48.3%, a difference of 0.040%), Slovak (48.3%, a difference of 0.050%), and Immigrants from England (48.3%, a difference of 0.060%).
| Demographics | Rating | Rank | Currently Married |
| Latvians | 98.7 /100 | #56 | Exceptional 48.5% |
| Immigrants | Netherlands | 98.6 /100 | #57 | Exceptional 48.5% |
| French | 98.6 /100 | #58 | Exceptional 48.4% |
| Immigrants | Ireland | 98.5 /100 | #59 | Exceptional 48.4% |
| Immigrants | Romania | 98.5 /100 | #60 | Exceptional 48.4% |
| Romanians | 98.5 /100 | #61 | Exceptional 48.4% |
| Asians | 98.5 /100 | #62 | Exceptional 48.4% |
| Slavs | 98.3 /100 | #63 | Exceptional 48.4% |
| Immigrants | Czechoslovakia | 98.3 /100 | #64 | Exceptional 48.4% |
| Ukrainians | 98.3 /100 | #65 | Exceptional 48.4% |
| Tongans | 98.2 /100 | #66 | Exceptional 48.3% |
| Slovaks | 98.2 /100 | #67 | Exceptional 48.3% |
| Immigrants | England | 98.2 /100 | #68 | Exceptional 48.3% |
| Canadians | 98.1 /100 | #69 | Exceptional 48.3% |
| Immigrants | Asia | 97.9 /100 | #70 | Exceptional 48.3% |
Demographics Similar to Croatians by Currently Married
In terms of currently married, the demographic groups most similar to Croatians are Eastern European (48.9%, a difference of 0.010%), Polish (48.9%, a difference of 0.010%), Immigrants from Hong Kong (48.9%, a difference of 0.020%), Welsh (48.9%, a difference of 0.050%), and Irish (48.9%, a difference of 0.060%).
| Demographics | Rating | Rank | Currently Married |
| Bulgarians | 99.7 /100 | #22 | Exceptional 49.1% |
| Immigrants | Pakistan | 99.7 /100 | #23 | Exceptional 49.1% |
| Lithuanians | 99.6 /100 | #24 | Exceptional 49.0% |
| Maltese | 99.6 /100 | #25 | Exceptional 49.0% |
| Immigrants | Korea | 99.6 /100 | #26 | Exceptional 49.0% |
| Burmese | 99.6 /100 | #27 | Exceptional 48.9% |
| Welsh | 99.5 /100 | #28 | Exceptional 48.9% |
| Croatians | 99.5 /100 | #29 | Exceptional 48.9% |
| Eastern Europeans | 99.5 /100 | #30 | Exceptional 48.9% |
| Poles | 99.5 /100 | #31 | Exceptional 48.9% |
| Immigrants | Hong Kong | 99.5 /100 | #32 | Exceptional 48.9% |
| Irish | 99.5 /100 | #33 | Exceptional 48.9% |
| Immigrants | Lithuania | 99.4 /100 | #34 | Exceptional 48.8% |
| Immigrants | Northern Europe | 99.4 /100 | #35 | Exceptional 48.8% |
| Italians | 99.4 /100 | #36 | Exceptional 48.8% |