Immigrants from Yemen vs Apache Median Household Income
COMPARE
Immigrants from Yemen
Apache
Median Household Income
Median Household Income Comparison
Immigrants from Yemen
Apache
$65,194
MEDIAN HOUSEHOLD INCOME
0.0/ 100
METRIC RATING
338th/ 347
METRIC RANK
$70,927
MEDIAN HOUSEHOLD INCOME
0.0/ 100
METRIC RATING
316th/ 347
METRIC RANK
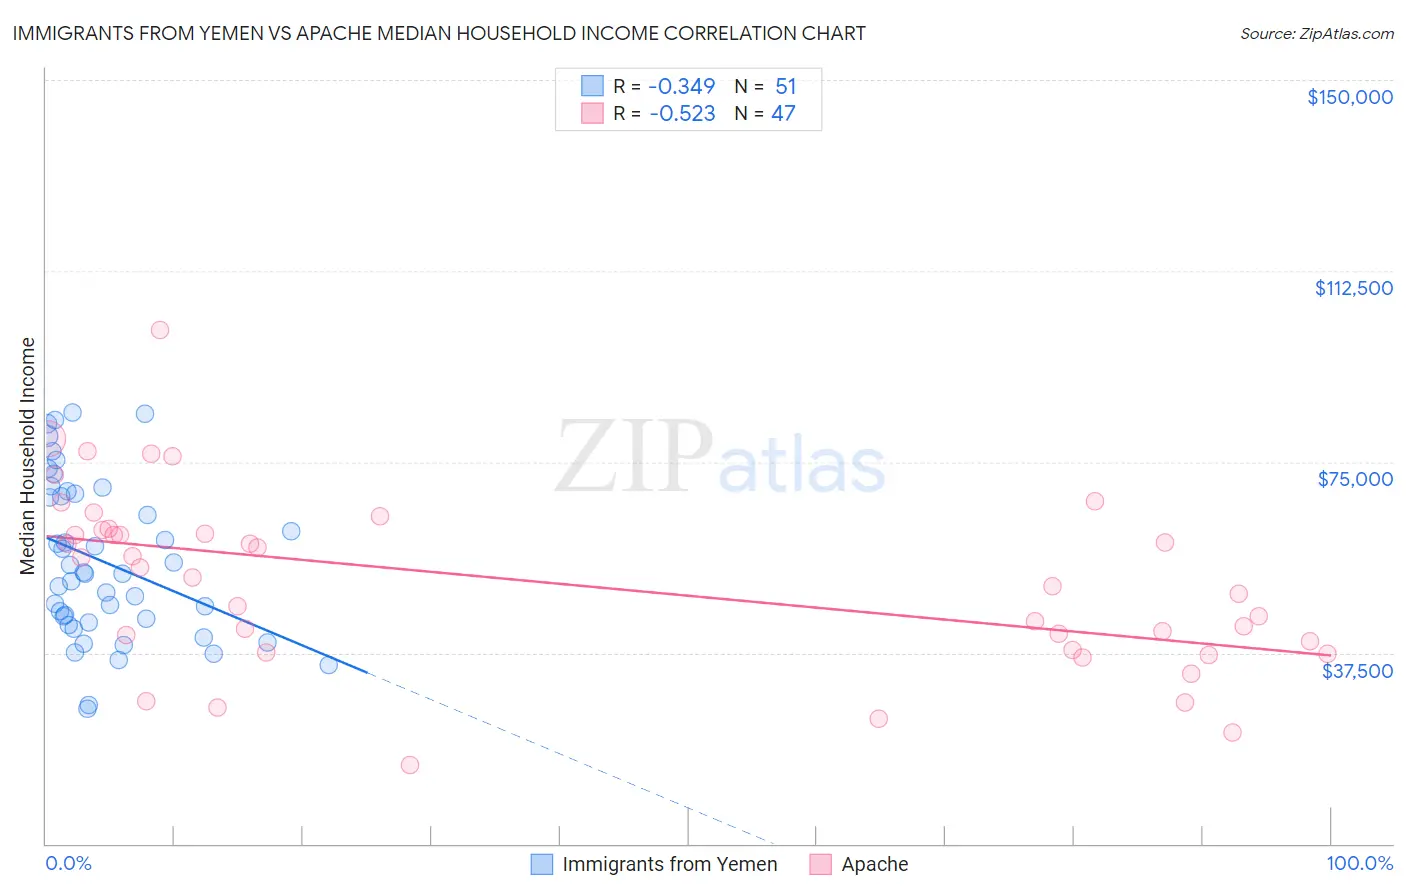
Immigrants from Yemen vs Apache Median Household Income Correlation Chart
The statistical analysis conducted on geographies consisting of 82,433,611 people shows a mild negative correlation between the proportion of Immigrants from Yemen and median household income in the United States with a correlation coefficient (R) of -0.349 and weighted average of $65,194. Similarly, the statistical analysis conducted on geographies consisting of 230,997,736 people shows a substantial negative correlation between the proportion of Apache and median household income in the United States with a correlation coefficient (R) of -0.523 and weighted average of $70,927, a difference of 8.8%.
Median Household Income Correlation Summary
| Measurement | Immigrants from Yemen | Apache |
| Minimum | $26,635 | $15,577 |
| Maximum | $84,689 | $100,781 |
| Range | $58,054 | $85,204 |
| Mean | $55,369 | $51,361 |
| Median | $53,125 | $52,202 |
| Interquartile 25% (IQ1) | $43,348 | $38,125 |
| Interquartile 75% (IQ3) | $68,707 | $61,561 |
| Interquartile Range (IQR) | $25,359 | $23,436 |
| Standard Deviation (Sample) | $15,452 | $17,390 |
| Standard Deviation (Population) | $15,299 | $17,204 |
Similar Demographics by Median Household Income
Demographics Similar to Immigrants from Yemen by Median Household Income
In terms of median household income, the demographic groups most similar to Immigrants from Yemen are Hopi ($65,043, a difference of 0.23%), Pueblo ($64,692, a difference of 0.78%), Kiowa ($65,914, a difference of 1.1%), Crow ($63,681, a difference of 2.4%), and Immigrants from Congo ($66,768, a difference of 2.4%).
| Demographics | Rating | Rank | Median Household Income |
| Natives/Alaskans | 0.0 /100 | #331 | Tragic $67,879 |
| Sioux | 0.0 /100 | #332 | Tragic $67,792 |
| Creek | 0.0 /100 | #333 | Tragic $67,715 |
| Blacks/African Americans | 0.0 /100 | #334 | Tragic $67,573 |
| Cheyenne | 0.0 /100 | #335 | Tragic $66,974 |
| Immigrants | Congo | 0.0 /100 | #336 | Tragic $66,768 |
| Kiowa | 0.0 /100 | #337 | Tragic $65,914 |
| Immigrants | Yemen | 0.0 /100 | #338 | Tragic $65,194 |
| Hopi | 0.0 /100 | #339 | Tragic $65,043 |
| Pueblo | 0.0 /100 | #340 | Tragic $64,692 |
| Crow | 0.0 /100 | #341 | Tragic $63,681 |
| Pima | 0.0 /100 | #342 | Tragic $63,262 |
| Houma | 0.0 /100 | #343 | Tragic $62,575 |
| Tohono O'odham | 0.0 /100 | #344 | Tragic $61,663 |
| Puerto Ricans | 0.0 /100 | #345 | Tragic $59,197 |
Demographics Similar to Apache by Median Household Income
In terms of median household income, the demographic groups most similar to Apache are Ottawa ($70,984, a difference of 0.080%), Cajun ($70,605, a difference of 0.46%), Dominican ($71,302, a difference of 0.53%), Chippewa ($70,539, a difference of 0.55%), and Immigrants from Bahamas ($71,349, a difference of 0.59%).
| Demographics | Rating | Rank | Median Household Income |
| Immigrants | Caribbean | 0.0 /100 | #309 | Tragic $71,860 |
| U.S. Virgin Islanders | 0.0 /100 | #310 | Tragic $71,853 |
| Immigrants | Zaire | 0.0 /100 | #311 | Tragic $71,801 |
| Immigrants | Honduras | 0.0 /100 | #312 | Tragic $71,452 |
| Immigrants | Bahamas | 0.0 /100 | #313 | Tragic $71,349 |
| Dominicans | 0.0 /100 | #314 | Tragic $71,302 |
| Ottawa | 0.0 /100 | #315 | Tragic $70,984 |
| Apache | 0.0 /100 | #316 | Tragic $70,927 |
| Cajuns | 0.0 /100 | #317 | Tragic $70,605 |
| Chippewa | 0.0 /100 | #318 | Tragic $70,539 |
| Immigrants | Dominican Republic | 0.0 /100 | #319 | Tragic $70,208 |
| Colville | 0.0 /100 | #320 | Tragic $70,094 |
| Chickasaw | 0.0 /100 | #321 | Tragic $70,005 |
| Choctaw | 0.0 /100 | #322 | Tragic $69,947 |
| Bahamians | 0.0 /100 | #323 | Tragic $69,726 |