Central American vs Apache Median Household Income
COMPARE
Central American
Apache
Median Household Income
Median Household Income Comparison
Central Americans
Apache
$78,803
MEDIAN HOUSEHOLD INCOME
1.7/ 100
METRIC RATING
246th/ 347
METRIC RANK
$70,927
MEDIAN HOUSEHOLD INCOME
0.0/ 100
METRIC RATING
316th/ 347
METRIC RANK
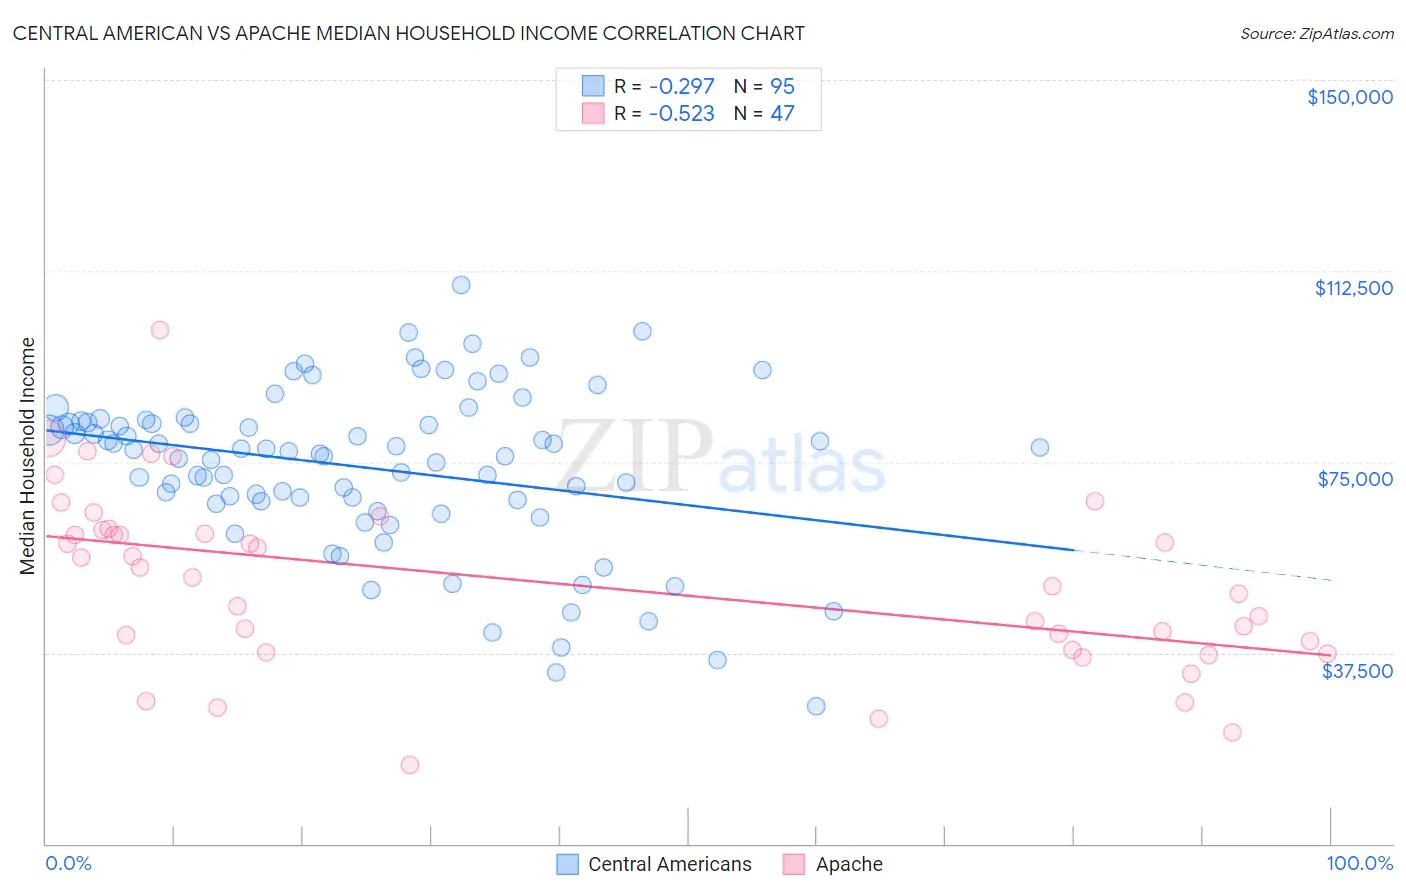
Central American vs Apache Median Household Income Correlation Chart
The statistical analysis conducted on geographies consisting of 503,881,037 people shows a weak negative correlation between the proportion of Central Americans and median household income in the United States with a correlation coefficient (R) of -0.297 and weighted average of $78,803. Similarly, the statistical analysis conducted on geographies consisting of 230,997,736 people shows a substantial negative correlation between the proportion of Apache and median household income in the United States with a correlation coefficient (R) of -0.523 and weighted average of $70,927, a difference of 11.1%.
Median Household Income Correlation Summary
| Measurement | Central American | Apache |
| Minimum | $26,979 | $15,577 |
| Maximum | $109,623 | $100,781 |
| Range | $82,644 | $85,204 |
| Mean | $73,852 | $51,361 |
| Median | $77,087 | $52,202 |
| Interquartile 25% (IQ1) | $67,287 | $38,125 |
| Interquartile 75% (IQ3) | $82,754 | $61,561 |
| Interquartile Range (IQR) | $15,467 | $23,436 |
| Standard Deviation (Sample) | $15,929 | $17,390 |
| Standard Deviation (Population) | $15,845 | $17,204 |
Similar Demographics by Median Household Income
Demographics Similar to Central Americans by Median Household Income
In terms of median household income, the demographic groups most similar to Central Americans are Inupiat ($78,841, a difference of 0.050%), Immigrants from Burma/Myanmar ($78,682, a difference of 0.15%), Marshallese ($78,930, a difference of 0.16%), Immigrants from Barbados ($78,989, a difference of 0.24%), and Sudanese ($78,529, a difference of 0.35%).
| Demographics | Rating | Rank | Median Household Income |
| Alaska Natives | 2.7 /100 | #239 | Tragic $79,509 |
| Immigrants | Western Africa | 2.7 /100 | #240 | Tragic $79,490 |
| Immigrants | Nonimmigrants | 2.6 /100 | #241 | Tragic $79,429 |
| Immigrants | Sudan | 2.1 /100 | #242 | Tragic $79,103 |
| Immigrants | Barbados | 1.9 /100 | #243 | Tragic $78,989 |
| Marshallese | 1.9 /100 | #244 | Tragic $78,930 |
| Inupiat | 1.8 /100 | #245 | Tragic $78,841 |
| Central Americans | 1.7 /100 | #246 | Tragic $78,803 |
| Immigrants | Burma/Myanmar | 1.6 /100 | #247 | Tragic $78,682 |
| Sudanese | 1.5 /100 | #248 | Tragic $78,529 |
| West Indians | 1.4 /100 | #249 | Tragic $78,455 |
| Immigrants | Laos | 1.3 /100 | #250 | Tragic $78,327 |
| Mexican American Indians | 1.2 /100 | #251 | Tragic $78,166 |
| Immigrants | West Indies | 1.0 /100 | #252 | Tragic $77,956 |
| Immigrants | St. Vincent and the Grenadines | 0.9 /100 | #253 | Tragic $77,690 |
Demographics Similar to Apache by Median Household Income
In terms of median household income, the demographic groups most similar to Apache are Ottawa ($70,984, a difference of 0.080%), Cajun ($70,605, a difference of 0.46%), Dominican ($71,302, a difference of 0.53%), Chippewa ($70,539, a difference of 0.55%), and Immigrants from Bahamas ($71,349, a difference of 0.59%).
| Demographics | Rating | Rank | Median Household Income |
| Immigrants | Caribbean | 0.0 /100 | #309 | Tragic $71,860 |
| U.S. Virgin Islanders | 0.0 /100 | #310 | Tragic $71,853 |
| Immigrants | Zaire | 0.0 /100 | #311 | Tragic $71,801 |
| Immigrants | Honduras | 0.0 /100 | #312 | Tragic $71,452 |
| Immigrants | Bahamas | 0.0 /100 | #313 | Tragic $71,349 |
| Dominicans | 0.0 /100 | #314 | Tragic $71,302 |
| Ottawa | 0.0 /100 | #315 | Tragic $70,984 |
| Apache | 0.0 /100 | #316 | Tragic $70,927 |
| Cajuns | 0.0 /100 | #317 | Tragic $70,605 |
| Chippewa | 0.0 /100 | #318 | Tragic $70,539 |
| Immigrants | Dominican Republic | 0.0 /100 | #319 | Tragic $70,208 |
| Colville | 0.0 /100 | #320 | Tragic $70,094 |
| Chickasaw | 0.0 /100 | #321 | Tragic $70,005 |
| Choctaw | 0.0 /100 | #322 | Tragic $69,947 |
| Bahamians | 0.0 /100 | #323 | Tragic $69,726 |