Immigrants from Asia vs Immigrants from Western Europe Wage/Income Gap
COMPARE
Immigrants from Asia
Immigrants from Western Europe
Wage/Income Gap
Wage/Income Gap Comparison
Immigrants from Asia
Immigrants from Western Europe
27.0%
WAGE/INCOME GAP
5.5/ 100
METRIC RATING
229th/ 347
METRIC RANK
27.8%
WAGE/INCOME GAP
0.9/ 100
METRIC RATING
270th/ 347
METRIC RANK
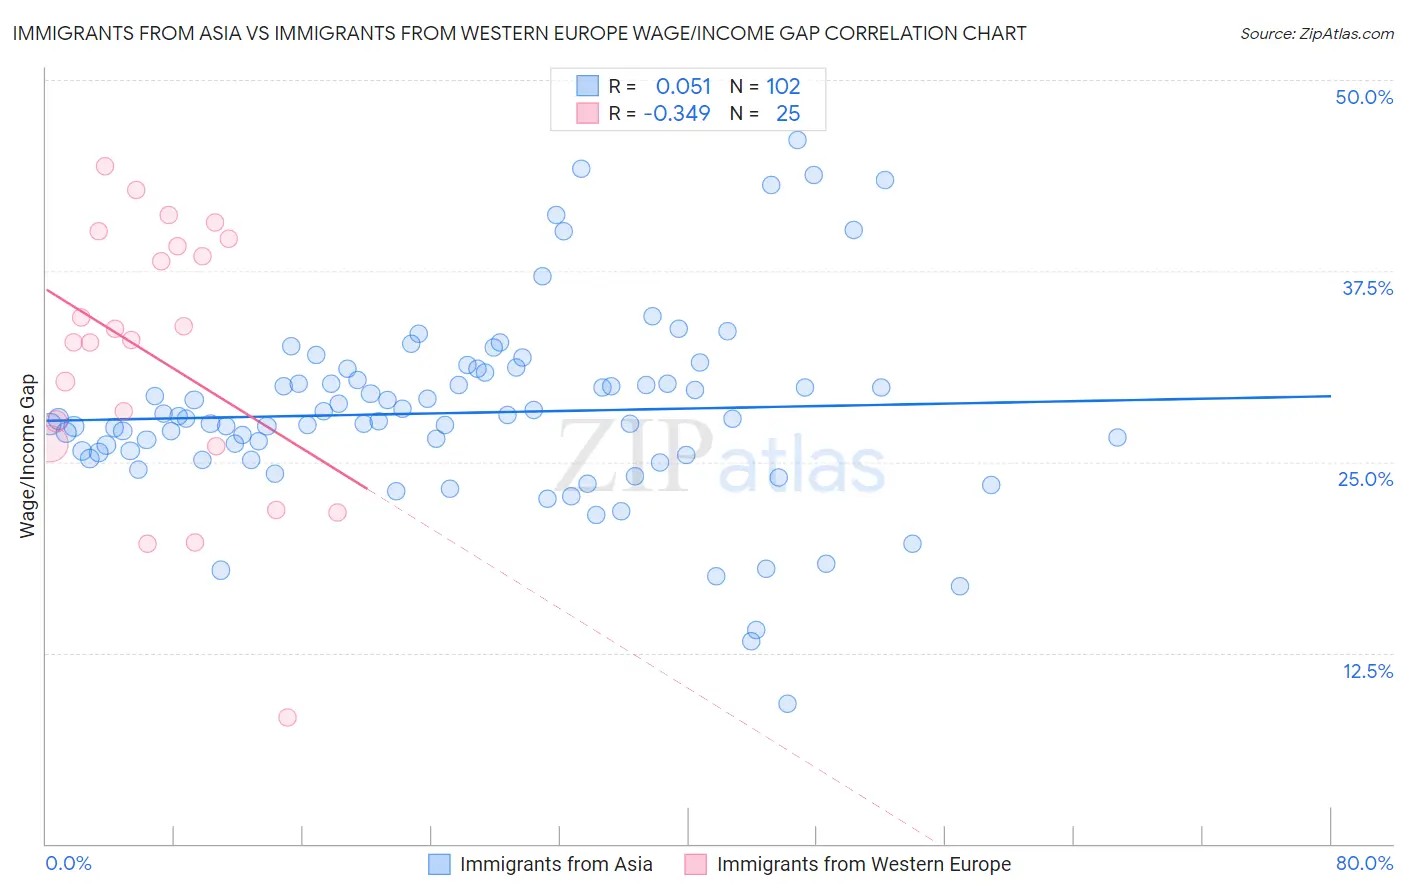
Immigrants from Asia vs Immigrants from Western Europe Wage/Income Gap Correlation Chart
The statistical analysis conducted on geographies consisting of 547,716,290 people shows a slight positive correlation between the proportion of Immigrants from Asia and wage/income gap percentage in the United States with a correlation coefficient (R) of 0.051 and weighted average of 27.0%. Similarly, the statistical analysis conducted on geographies consisting of 493,207,642 people shows a mild negative correlation between the proportion of Immigrants from Western Europe and wage/income gap percentage in the United States with a correlation coefficient (R) of -0.349 and weighted average of 27.8%, a difference of 2.9%.
Wage/Income Gap Correlation Summary
| Measurement | Immigrants from Asia | Immigrants from Western Europe |
| Minimum | 9.2% | 8.2% |
| Maximum | 46.1% | 44.3% |
| Range | 36.9% | 36.1% |
| Mean | 28.2% | 31.8% |
| Median | 27.8% | 33.0% |
| Interquartile 25% (IQ1) | 25.4% | 26.1% |
| Interquartile 75% (IQ3) | 30.4% | 39.4% |
| Interquartile Range (IQR) | 4.9% | 13.2% |
| Standard Deviation (Sample) | 6.3% | 8.8% |
| Standard Deviation (Population) | 6.2% | 8.7% |
Similar Demographics by Wage/Income Gap
Demographics Similar to Immigrants from Asia by Wage/Income Gap
In terms of wage/income gap, the demographic groups most similar to Immigrants from Asia are Immigrants from Turkey (27.0%, a difference of 0.030%), Spaniard (27.0%, a difference of 0.040%), Ottawa (27.0%, a difference of 0.050%), Bhutanese (27.0%, a difference of 0.070%), and Argentinean (27.0%, a difference of 0.10%).
| Demographics | Rating | Rank | Wage/Income Gap |
| Bolivians | 8.3 /100 | #222 | Tragic 26.8% |
| Jordanians | 8.0 /100 | #223 | Tragic 26.8% |
| Immigrants | Argentina | 7.2 /100 | #224 | Tragic 26.8% |
| Immigrants | Ireland | 6.5 /100 | #225 | Tragic 26.9% |
| Asians | 5.9 /100 | #226 | Tragic 26.9% |
| Spaniards | 5.6 /100 | #227 | Tragic 27.0% |
| Immigrants | Turkey | 5.6 /100 | #228 | Tragic 27.0% |
| Immigrants | Asia | 5.5 /100 | #229 | Tragic 27.0% |
| Ottawa | 5.3 /100 | #230 | Tragic 27.0% |
| Bhutanese | 5.3 /100 | #231 | Tragic 27.0% |
| Argentineans | 5.2 /100 | #232 | Tragic 27.0% |
| Immigrants | Brazil | 5.0 /100 | #233 | Tragic 27.0% |
| Immigrants | Pakistan | 4.9 /100 | #234 | Tragic 27.0% |
| Immigrants | Hungary | 4.8 /100 | #235 | Tragic 27.0% |
| Immigrants | Romania | 4.8 /100 | #236 | Tragic 27.0% |
Demographics Similar to Immigrants from Western Europe by Wage/Income Gap
In terms of wage/income gap, the demographic groups most similar to Immigrants from Western Europe are Ute (27.8%, a difference of 0.080%), Potawatomi (27.7%, a difference of 0.12%), New Zealander (27.7%, a difference of 0.13%), Immigrants from Korea (27.8%, a difference of 0.15%), and Turkish (27.7%, a difference of 0.21%).
| Demographics | Rating | Rank | Wage/Income Gap |
| Syrians | 1.4 /100 | #263 | Tragic 27.6% |
| Immigrants | Switzerland | 1.0 /100 | #264 | Tragic 27.7% |
| Serbians | 1.0 /100 | #265 | Tragic 27.7% |
| Hmong | 1.0 /100 | #266 | Tragic 27.7% |
| Turks | 1.0 /100 | #267 | Tragic 27.7% |
| New Zealanders | 1.0 /100 | #268 | Tragic 27.7% |
| Potawatomi | 0.9 /100 | #269 | Tragic 27.7% |
| Immigrants | Western Europe | 0.9 /100 | #270 | Tragic 27.8% |
| Ute | 0.8 /100 | #271 | Tragic 27.8% |
| Immigrants | Korea | 0.8 /100 | #272 | Tragic 27.8% |
| Bulgarians | 0.7 /100 | #273 | Tragic 27.8% |
| Americans | 0.7 /100 | #274 | Tragic 27.8% |
| Immigrants | Japan | 0.7 /100 | #275 | Tragic 27.9% |
| Lebanese | 0.7 /100 | #276 | Tragic 27.9% |
| Latvians | 0.7 /100 | #277 | Tragic 27.9% |