Shoshone vs Norwegian Householder Income Ages 25 - 44 years
COMPARE
Shoshone
Norwegian
Householder Income Ages 25 - 44 years
Householder Income Ages 25 - 44 years Comparison
Shoshone
Norwegians
$82,062
HOUSEHOLDER INCOME AGES 25 - 44 YEARS
0.1/ 100
METRIC RATING
289th/ 347
METRIC RANK
$96,866
HOUSEHOLDER INCOME AGES 25 - 44 YEARS
78.2/ 100
METRIC RATING
145th/ 347
METRIC RANK
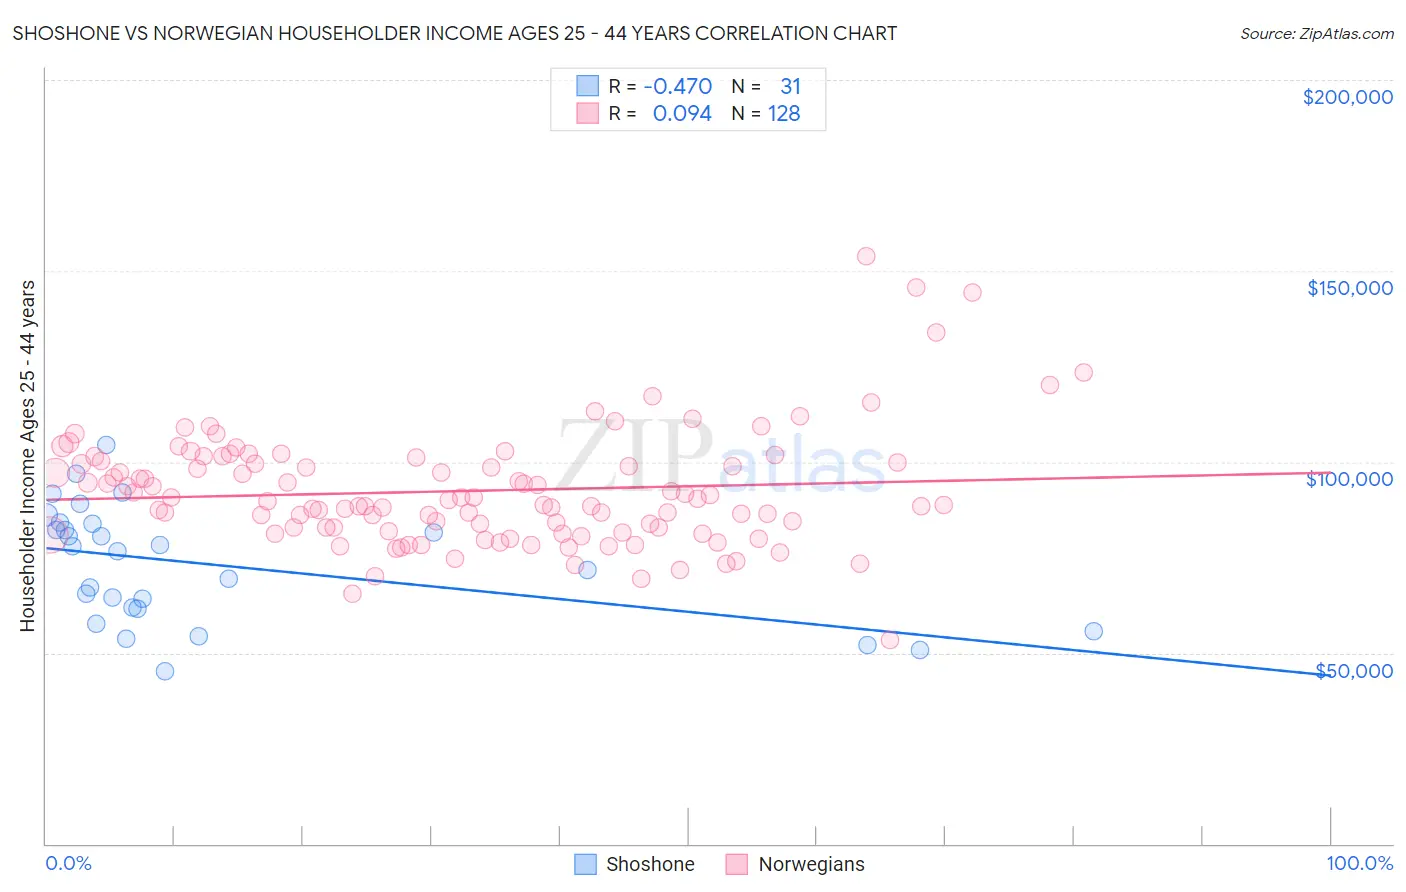
Shoshone vs Norwegian Householder Income Ages 25 - 44 years Correlation Chart
The statistical analysis conducted on geographies consisting of 66,542,705 people shows a moderate negative correlation between the proportion of Shoshone and household income with householder between the ages 25 and 44 in the United States with a correlation coefficient (R) of -0.470 and weighted average of $82,062. Similarly, the statistical analysis conducted on geographies consisting of 529,618,426 people shows a slight positive correlation between the proportion of Norwegians and household income with householder between the ages 25 and 44 in the United States with a correlation coefficient (R) of 0.094 and weighted average of $96,866, a difference of 18.0%.
Householder Income Ages 25 - 44 years Correlation Summary
| Measurement | Shoshone | Norwegian |
| Minimum | $45,294 | $53,269 |
| Maximum | $104,318 | $153,750 |
| Range | $59,024 | $100,481 |
| Mean | $72,987 | $92,386 |
| Median | $76,509 | $89,798 |
| Interquartile 25% (IQ1) | $61,583 | $82,344 |
| Interquartile 75% (IQ3) | $83,906 | $100,008 |
| Interquartile Range (IQR) | $22,323 | $17,664 |
| Standard Deviation (Sample) | $15,076 | $15,216 |
| Standard Deviation (Population) | $14,831 | $15,156 |
Similar Demographics by Householder Income Ages 25 - 44 years
Demographics Similar to Shoshone by Householder Income Ages 25 - 44 years
In terms of householder income ages 25 - 44 years, the demographic groups most similar to Shoshone are Liberian ($82,005, a difference of 0.070%), Comanche ($82,152, a difference of 0.11%), Ute ($82,166, a difference of 0.13%), Immigrants from Latin America ($82,166, a difference of 0.13%), and Immigrants from Somalia ($82,188, a difference of 0.15%).
| Demographics | Rating | Rank | Householder Income Ages 25 - 44 years |
| Central American Indians | 0.1 /100 | #282 | Tragic $82,355 |
| Guatemalans | 0.1 /100 | #283 | Tragic $82,331 |
| Immigrants | Middle Africa | 0.1 /100 | #284 | Tragic $82,254 |
| Immigrants | Somalia | 0.1 /100 | #285 | Tragic $82,188 |
| Ute | 0.1 /100 | #286 | Tragic $82,166 |
| Immigrants | Latin America | 0.1 /100 | #287 | Tragic $82,166 |
| Comanche | 0.1 /100 | #288 | Tragic $82,152 |
| Shoshone | 0.1 /100 | #289 | Tragic $82,062 |
| Liberians | 0.1 /100 | #290 | Tragic $82,005 |
| Potawatomi | 0.1 /100 | #291 | Tragic $81,774 |
| Yaqui | 0.1 /100 | #292 | Tragic $81,656 |
| Blackfeet | 0.1 /100 | #293 | Tragic $81,531 |
| Cubans | 0.1 /100 | #294 | Tragic $81,483 |
| Bangladeshis | 0.1 /100 | #295 | Tragic $81,363 |
| Immigrants | Dominica | 0.1 /100 | #296 | Tragic $81,351 |
Demographics Similar to Norwegians by Householder Income Ages 25 - 44 years
In terms of householder income ages 25 - 44 years, the demographic groups most similar to Norwegians are Ethiopian ($96,824, a difference of 0.040%), Immigrants from Syria ($96,789, a difference of 0.080%), Irish ($96,730, a difference of 0.14%), Basque ($96,709, a difference of 0.16%), and Ugandan ($96,667, a difference of 0.21%).
| Demographics | Rating | Rank | Householder Income Ages 25 - 44 years |
| Arabs | 82.3 /100 | #138 | Excellent $97,336 |
| Immigrants | Peru | 82.2 /100 | #139 | Excellent $97,329 |
| Immigrants | Morocco | 82.0 /100 | #140 | Excellent $97,305 |
| Luxembourgers | 81.5 /100 | #141 | Excellent $97,237 |
| Danes | 81.3 /100 | #142 | Excellent $97,221 |
| Immigrants | Jordan | 81.0 /100 | #143 | Excellent $97,185 |
| Immigrants | Chile | 80.8 /100 | #144 | Excellent $97,159 |
| Norwegians | 78.2 /100 | #145 | Good $96,866 |
| Ethiopians | 77.8 /100 | #146 | Good $96,824 |
| Immigrants | Syria | 77.4 /100 | #147 | Good $96,789 |
| Irish | 76.9 /100 | #148 | Good $96,730 |
| Basques | 76.6 /100 | #149 | Good $96,709 |
| Ugandans | 76.2 /100 | #150 | Good $96,667 |
| Czechs | 74.8 /100 | #151 | Good $96,525 |
| South American Indians | 74.5 /100 | #152 | Good $96,497 |