Shoshone vs Immigrants from India Householder Income Ages 25 - 44 years
COMPARE
Shoshone
Immigrants from India
Householder Income Ages 25 - 44 years
Householder Income Ages 25 - 44 years Comparison
Shoshone
Immigrants from India
$82,062
HOUSEHOLDER INCOME AGES 25 - 44 YEARS
0.1/ 100
METRIC RATING
289th/ 347
METRIC RANK
$124,238
HOUSEHOLDER INCOME AGES 25 - 44 YEARS
100.0/ 100
METRIC RATING
5th/ 347
METRIC RANK
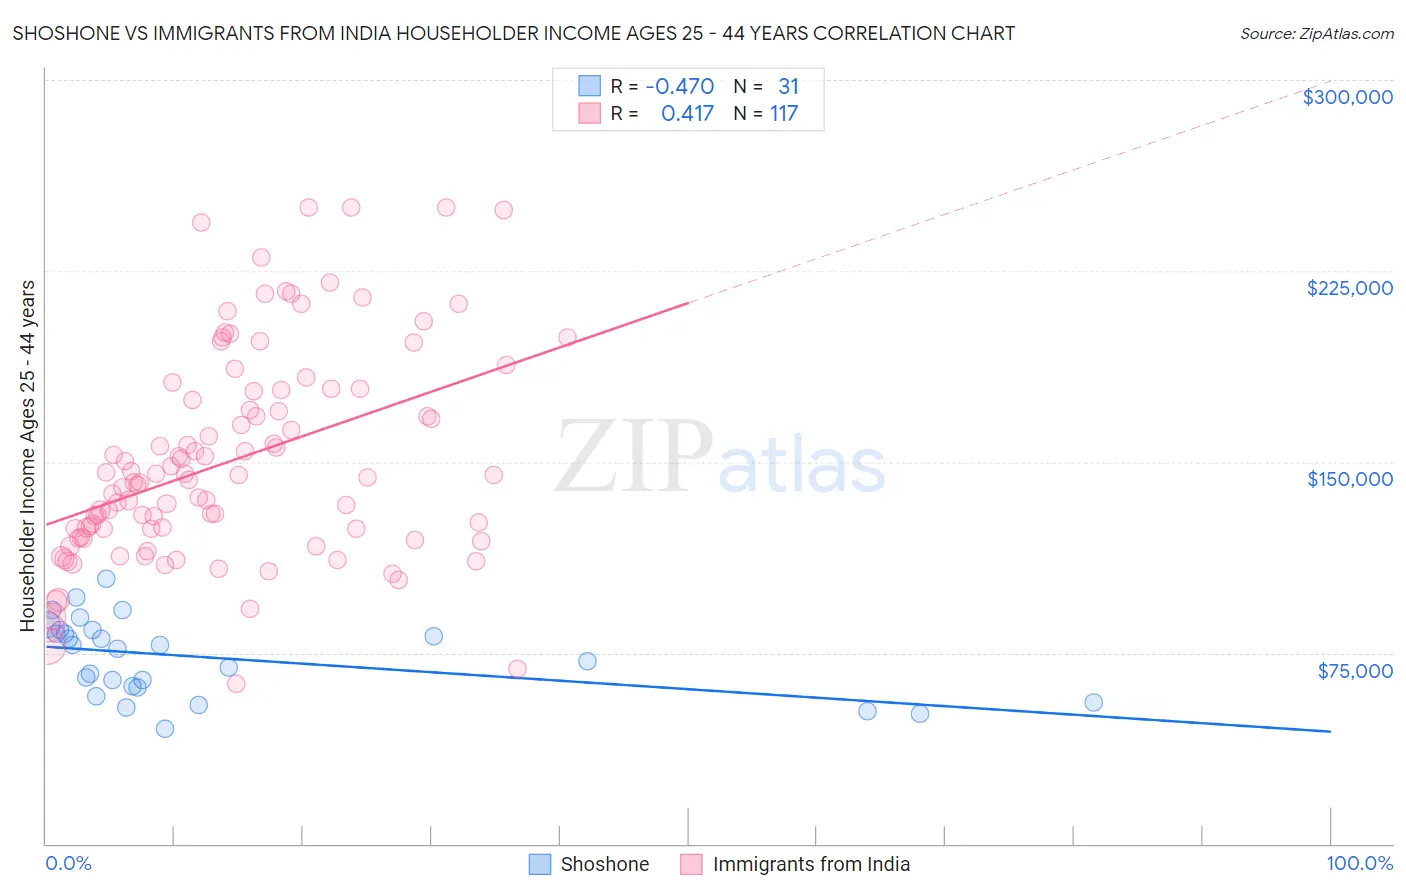
Shoshone vs Immigrants from India Householder Income Ages 25 - 44 years Correlation Chart
The statistical analysis conducted on geographies consisting of 66,542,705 people shows a moderate negative correlation between the proportion of Shoshone and household income with householder between the ages 25 and 44 in the United States with a correlation coefficient (R) of -0.470 and weighted average of $82,062. Similarly, the statistical analysis conducted on geographies consisting of 432,826,792 people shows a moderate positive correlation between the proportion of Immigrants from India and household income with householder between the ages 25 and 44 in the United States with a correlation coefficient (R) of 0.417 and weighted average of $124,238, a difference of 51.4%.
Householder Income Ages 25 - 44 years Correlation Summary
| Measurement | Shoshone | Immigrants from India |
| Minimum | $45,294 | $63,072 |
| Maximum | $104,318 | $250,001 |
| Range | $59,024 | $186,929 |
| Mean | $72,987 | $150,115 |
| Median | $76,509 | $143,110 |
| Interquartile 25% (IQ1) | $61,583 | $120,254 |
| Interquartile 75% (IQ3) | $83,906 | $177,993 |
| Interquartile Range (IQR) | $22,323 | $57,739 |
| Standard Deviation (Sample) | $15,076 | $41,287 |
| Standard Deviation (Population) | $14,831 | $41,110 |
Similar Demographics by Householder Income Ages 25 - 44 years
Demographics Similar to Shoshone by Householder Income Ages 25 - 44 years
In terms of householder income ages 25 - 44 years, the demographic groups most similar to Shoshone are Liberian ($82,005, a difference of 0.070%), Comanche ($82,152, a difference of 0.11%), Ute ($82,166, a difference of 0.13%), Immigrants from Latin America ($82,166, a difference of 0.13%), and Immigrants from Somalia ($82,188, a difference of 0.15%).
| Demographics | Rating | Rank | Householder Income Ages 25 - 44 years |
| Central American Indians | 0.1 /100 | #282 | Tragic $82,355 |
| Guatemalans | 0.1 /100 | #283 | Tragic $82,331 |
| Immigrants | Middle Africa | 0.1 /100 | #284 | Tragic $82,254 |
| Immigrants | Somalia | 0.1 /100 | #285 | Tragic $82,188 |
| Ute | 0.1 /100 | #286 | Tragic $82,166 |
| Immigrants | Latin America | 0.1 /100 | #287 | Tragic $82,166 |
| Comanche | 0.1 /100 | #288 | Tragic $82,152 |
| Shoshone | 0.1 /100 | #289 | Tragic $82,062 |
| Liberians | 0.1 /100 | #290 | Tragic $82,005 |
| Potawatomi | 0.1 /100 | #291 | Tragic $81,774 |
| Yaqui | 0.1 /100 | #292 | Tragic $81,656 |
| Blackfeet | 0.1 /100 | #293 | Tragic $81,531 |
| Cubans | 0.1 /100 | #294 | Tragic $81,483 |
| Bangladeshis | 0.1 /100 | #295 | Tragic $81,363 |
| Immigrants | Dominica | 0.1 /100 | #296 | Tragic $81,351 |
Demographics Similar to Immigrants from India by Householder Income Ages 25 - 44 years
In terms of householder income ages 25 - 44 years, the demographic groups most similar to Immigrants from India are Immigrants from Singapore ($124,429, a difference of 0.15%), Thai ($121,778, a difference of 2.0%), Immigrants from Hong Kong ($128,140, a difference of 3.1%), Immigrants from Ireland ($120,333, a difference of 3.3%), and Iranian ($120,292, a difference of 3.3%).
| Demographics | Rating | Rank | Householder Income Ages 25 - 44 years |
| Immigrants | Taiwan | 100.0 /100 | #1 | Exceptional $129,122 |
| Filipinos | 100.0 /100 | #2 | Exceptional $128,723 |
| Immigrants | Hong Kong | 100.0 /100 | #3 | Exceptional $128,140 |
| Immigrants | Singapore | 100.0 /100 | #4 | Exceptional $124,429 |
| Immigrants | India | 100.0 /100 | #5 | Exceptional $124,238 |
| Thais | 100.0 /100 | #6 | Exceptional $121,778 |
| Immigrants | Ireland | 100.0 /100 | #7 | Exceptional $120,333 |
| Iranians | 100.0 /100 | #8 | Exceptional $120,292 |
| Immigrants | China | 100.0 /100 | #9 | Exceptional $119,756 |
| Indians (Asian) | 100.0 /100 | #10 | Exceptional $119,496 |
| Okinawans | 100.0 /100 | #11 | Exceptional $119,349 |
| Immigrants | Iran | 100.0 /100 | #12 | Exceptional $119,204 |
| Immigrants | Eastern Asia | 100.0 /100 | #13 | Exceptional $118,056 |
| Immigrants | Israel | 100.0 /100 | #14 | Exceptional $117,219 |
| Immigrants | South Central Asia | 100.0 /100 | #15 | Exceptional $116,626 |