Shoshone vs Choctaw Householder Income Ages 25 - 44 years
COMPARE
Shoshone
Choctaw
Householder Income Ages 25 - 44 years
Householder Income Ages 25 - 44 years Comparison
Shoshone
Choctaw
$82,062
HOUSEHOLDER INCOME AGES 25 - 44 YEARS
0.1/ 100
METRIC RATING
289th/ 347
METRIC RANK
$78,168
HOUSEHOLDER INCOME AGES 25 - 44 YEARS
0.0/ 100
METRIC RATING
320th/ 347
METRIC RANK
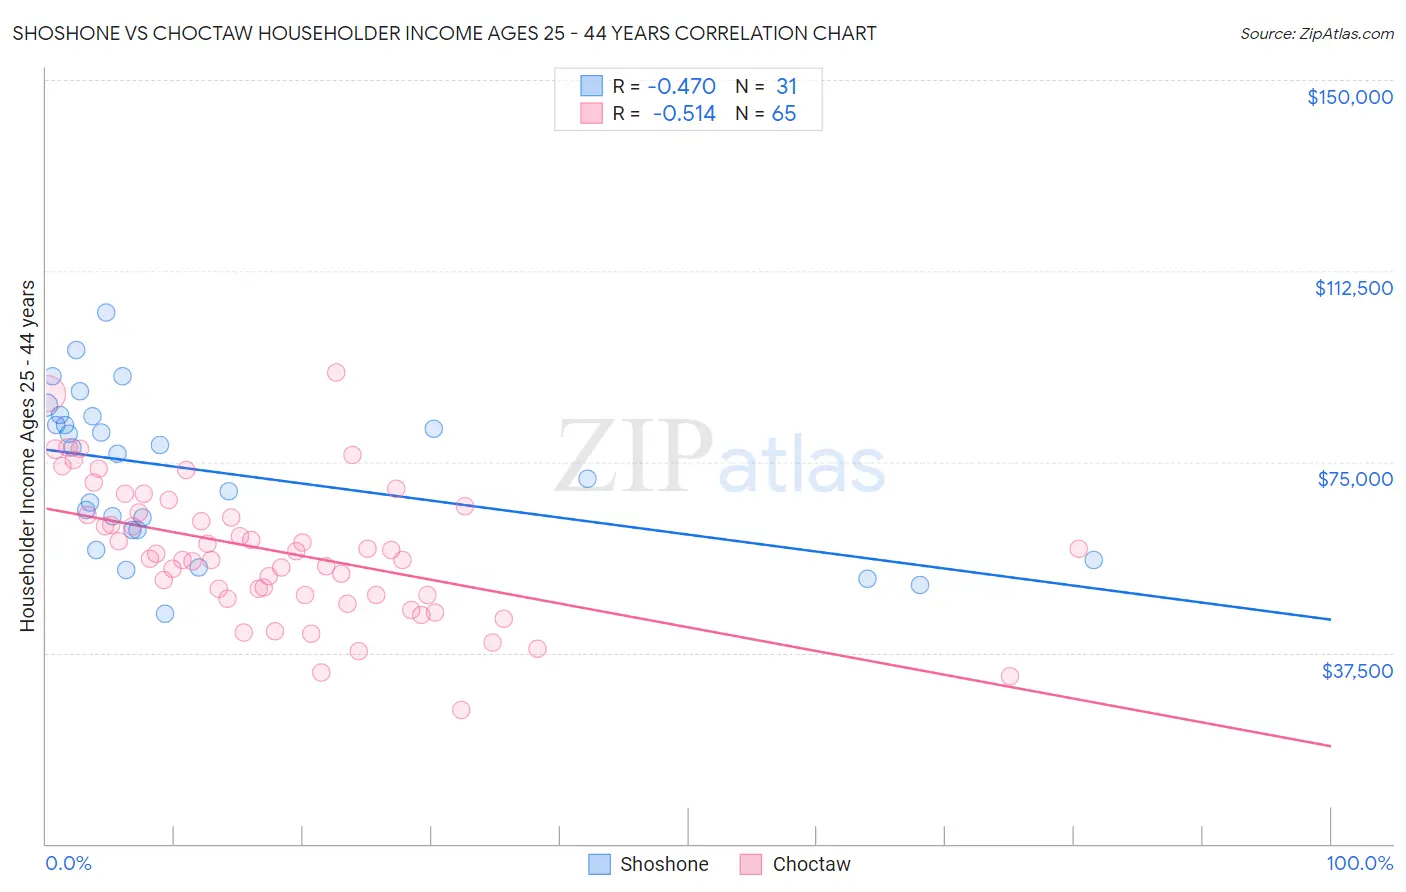
Shoshone vs Choctaw Householder Income Ages 25 - 44 years Correlation Chart
The statistical analysis conducted on geographies consisting of 66,542,705 people shows a moderate negative correlation between the proportion of Shoshone and household income with householder between the ages 25 and 44 in the United States with a correlation coefficient (R) of -0.470 and weighted average of $82,062. Similarly, the statistical analysis conducted on geographies consisting of 269,000,515 people shows a substantial negative correlation between the proportion of Choctaw and household income with householder between the ages 25 and 44 in the United States with a correlation coefficient (R) of -0.514 and weighted average of $78,168, a difference of 5.0%.
Householder Income Ages 25 - 44 years Correlation Summary
| Measurement | Shoshone | Choctaw |
| Minimum | $45,294 | $26,250 |
| Maximum | $104,318 | $92,500 |
| Range | $59,024 | $66,250 |
| Mean | $72,987 | $57,418 |
| Median | $76,509 | $56,972 |
| Interquartile 25% (IQ1) | $61,583 | $48,750 |
| Interquartile 75% (IQ3) | $83,906 | $65,678 |
| Interquartile Range (IQR) | $22,323 | $16,928 |
| Standard Deviation (Sample) | $15,076 | $13,252 |
| Standard Deviation (Population) | $14,831 | $13,150 |
Similar Demographics by Householder Income Ages 25 - 44 years
Demographics Similar to Shoshone by Householder Income Ages 25 - 44 years
In terms of householder income ages 25 - 44 years, the demographic groups most similar to Shoshone are Liberian ($82,005, a difference of 0.070%), Comanche ($82,152, a difference of 0.11%), Ute ($82,166, a difference of 0.13%), Immigrants from Latin America ($82,166, a difference of 0.13%), and Immigrants from Somalia ($82,188, a difference of 0.15%).
| Demographics | Rating | Rank | Householder Income Ages 25 - 44 years |
| Central American Indians | 0.1 /100 | #282 | Tragic $82,355 |
| Guatemalans | 0.1 /100 | #283 | Tragic $82,331 |
| Immigrants | Middle Africa | 0.1 /100 | #284 | Tragic $82,254 |
| Immigrants | Somalia | 0.1 /100 | #285 | Tragic $82,188 |
| Ute | 0.1 /100 | #286 | Tragic $82,166 |
| Immigrants | Latin America | 0.1 /100 | #287 | Tragic $82,166 |
| Comanche | 0.1 /100 | #288 | Tragic $82,152 |
| Shoshone | 0.1 /100 | #289 | Tragic $82,062 |
| Liberians | 0.1 /100 | #290 | Tragic $82,005 |
| Potawatomi | 0.1 /100 | #291 | Tragic $81,774 |
| Yaqui | 0.1 /100 | #292 | Tragic $81,656 |
| Blackfeet | 0.1 /100 | #293 | Tragic $81,531 |
| Cubans | 0.1 /100 | #294 | Tragic $81,483 |
| Bangladeshis | 0.1 /100 | #295 | Tragic $81,363 |
| Immigrants | Dominica | 0.1 /100 | #296 | Tragic $81,351 |
Demographics Similar to Choctaw by Householder Income Ages 25 - 44 years
In terms of householder income ages 25 - 44 years, the demographic groups most similar to Choctaw are Immigrants from Zaire ($78,045, a difference of 0.16%), Chickasaw ($77,929, a difference of 0.31%), Honduran ($78,540, a difference of 0.48%), Immigrants from Mexico ($78,809, a difference of 0.82%), and U.S. Virgin Islander ($78,911, a difference of 0.95%).
| Demographics | Rating | Rank | Householder Income Ages 25 - 44 years |
| Menominee | 0.0 /100 | #313 | Tragic $79,358 |
| Cheyenne | 0.0 /100 | #314 | Tragic $79,152 |
| Ottawa | 0.0 /100 | #315 | Tragic $79,012 |
| Africans | 0.0 /100 | #316 | Tragic $78,986 |
| U.S. Virgin Islanders | 0.0 /100 | #317 | Tragic $78,911 |
| Immigrants | Mexico | 0.0 /100 | #318 | Tragic $78,809 |
| Hondurans | 0.0 /100 | #319 | Tragic $78,540 |
| Choctaw | 0.0 /100 | #320 | Tragic $78,168 |
| Immigrants | Zaire | 0.0 /100 | #321 | Tragic $78,045 |
| Chickasaw | 0.0 /100 | #322 | Tragic $77,929 |
| Immigrants | Honduras | 0.0 /100 | #323 | Tragic $77,328 |
| Dutch West Indians | 0.0 /100 | #324 | Tragic $77,260 |
| Sioux | 0.0 /100 | #325 | Tragic $77,089 |
| Houma | 0.0 /100 | #326 | Tragic $77,044 |
| Immigrants | Bahamas | 0.0 /100 | #327 | Tragic $76,910 |