Welsh vs Aleut Householder Income Ages 25 - 44 years
COMPARE
Welsh
Aleut
Householder Income Ages 25 - 44 years
Householder Income Ages 25 - 44 years Comparison
Welsh
Aleuts
$93,039
HOUSEHOLDER INCOME AGES 25 - 44 YEARS
30.0/ 100
METRIC RATING
190th/ 347
METRIC RANK
$91,370
HOUSEHOLDER INCOME AGES 25 - 44 YEARS
14.5/ 100
METRIC RATING
206th/ 347
METRIC RANK
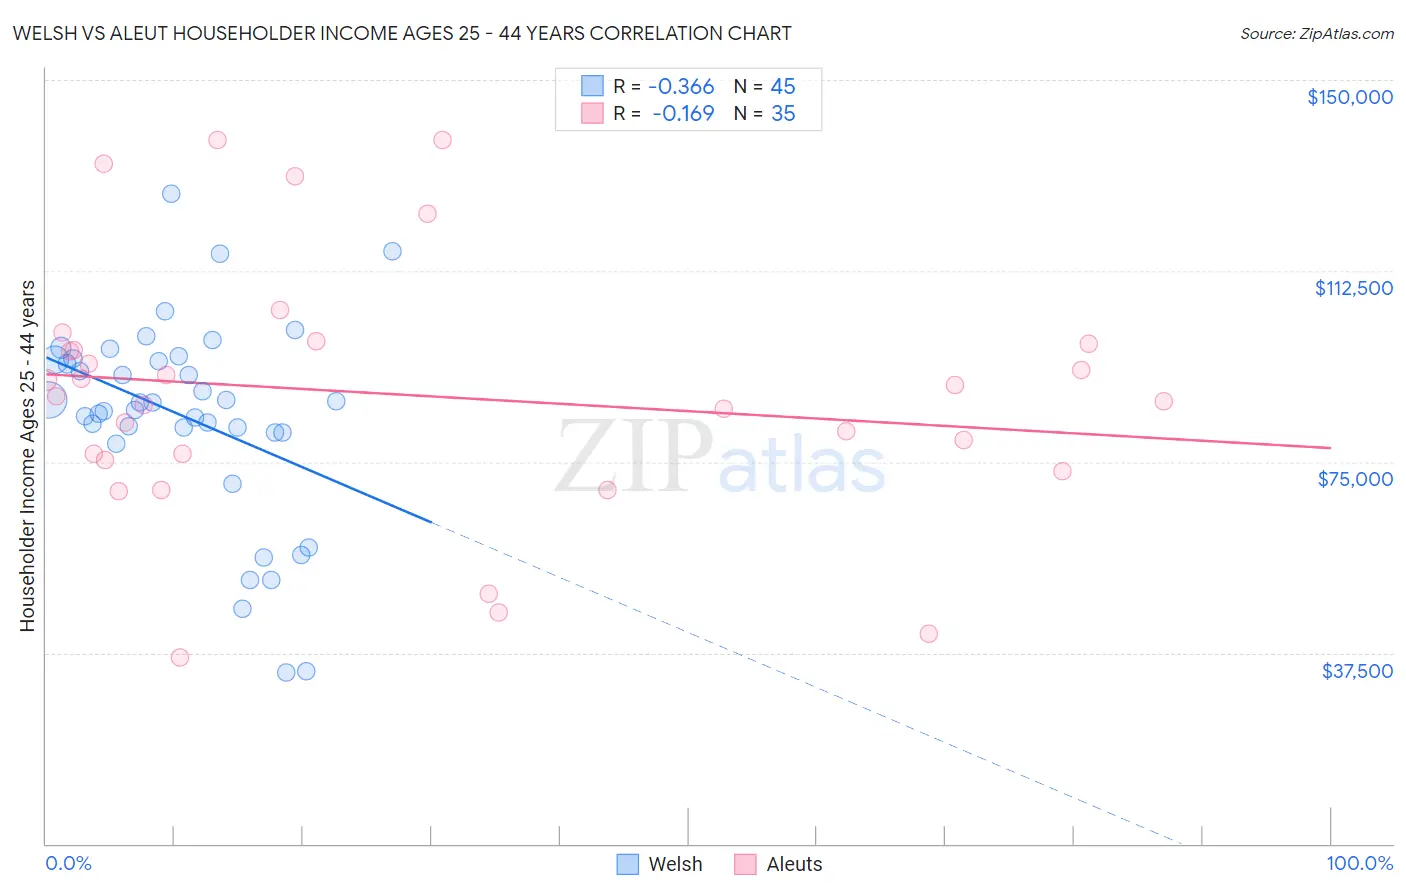
Welsh vs Aleut Householder Income Ages 25 - 44 years Correlation Chart
The statistical analysis conducted on geographies consisting of 524,969,019 people shows a mild negative correlation between the proportion of Welsh and household income with householder between the ages 25 and 44 in the United States with a correlation coefficient (R) of -0.366 and weighted average of $93,039. Similarly, the statistical analysis conducted on geographies consisting of 61,739,915 people shows a poor negative correlation between the proportion of Aleuts and household income with householder between the ages 25 and 44 in the United States with a correlation coefficient (R) of -0.169 and weighted average of $91,370, a difference of 1.8%.
Householder Income Ages 25 - 44 years Correlation Summary
| Measurement | Welsh | Aleut |
| Minimum | $33,750 | $36,667 |
| Maximum | $127,625 | $138,313 |
| Range | $93,875 | $101,646 |
| Mean | $83,695 | $88,134 |
| Median | $86,585 | $88,006 |
| Interquartile 25% (IQ1) | $80,749 | $75,410 |
| Interquartile 75% (IQ3) | $95,164 | $98,125 |
| Interquartile Range (IQR) | $14,415 | $22,715 |
| Standard Deviation (Sample) | $19,829 | $24,944 |
| Standard Deviation (Population) | $19,607 | $24,585 |
Demographics Similar to Welsh and Aleuts by Householder Income Ages 25 - 44 years
In terms of householder income ages 25 - 44 years, the demographic groups most similar to Welsh are Dutch ($93,081, a difference of 0.040%), Tlingit-Haida ($92,987, a difference of 0.060%), Immigrants from Sierra Leone ($93,115, a difference of 0.080%), Immigrants from Costa Rica ($92,876, a difference of 0.18%), and Samoan ($92,385, a difference of 0.71%). Similarly, the demographic groups most similar to Aleuts are Yugoslavian ($91,368, a difference of 0.0%), Immigrants from Thailand ($91,337, a difference of 0.040%), Immigrants from Eastern Africa ($91,458, a difference of 0.10%), Nepalese ($91,498, a difference of 0.14%), and Immigrants from Cambodia ($91,533, a difference of 0.18%).
| Demographics | Rating | Rank | Householder Income Ages 25 - 44 years |
| Immigrants | Sierra Leone | 30.9 /100 | #188 | Fair $93,115 |
| Dutch | 30.5 /100 | #189 | Fair $93,081 |
| Welsh | 30.0 /100 | #190 | Fair $93,039 |
| Tlingit-Haida | 29.4 /100 | #191 | Fair $92,987 |
| Immigrants | Costa Rica | 28.2 /100 | #192 | Fair $92,876 |
| Samoans | 23.0 /100 | #193 | Fair $92,385 |
| Immigrants | Azores | 22.4 /100 | #194 | Fair $92,322 |
| Celtics | 21.6 /100 | #195 | Fair $92,241 |
| Immigrants | Colombia | 21.3 /100 | #196 | Fair $92,204 |
| Spanish | 21.2 /100 | #197 | Fair $92,200 |
| Vietnamese | 20.2 /100 | #198 | Fair $92,089 |
| Kenyans | 16.8 /100 | #199 | Poor $91,684 |
| Whites/Caucasians | 16.7 /100 | #200 | Poor $91,668 |
| Japanese | 16.4 /100 | #201 | Poor $91,624 |
| Ecuadorians | 16.0 /100 | #202 | Poor $91,574 |
| Immigrants | Cambodia | 15.7 /100 | #203 | Poor $91,533 |
| Nepalese | 15.4 /100 | #204 | Poor $91,498 |
| Immigrants | Eastern Africa | 15.2 /100 | #205 | Poor $91,458 |
| Aleuts | 14.5 /100 | #206 | Poor $91,370 |
| Yugoslavians | 14.5 /100 | #207 | Poor $91,368 |
| Immigrants | Thailand | 14.3 /100 | #208 | Poor $91,337 |