South American Indian vs Aleut Householder Income Ages 25 - 44 years
COMPARE
South American Indian
Aleut
Householder Income Ages 25 - 44 years
Householder Income Ages 25 - 44 years Comparison
South American Indians
Aleuts
$96,497
HOUSEHOLDER INCOME AGES 25 - 44 YEARS
74.5/ 100
METRIC RATING
152nd/ 347
METRIC RANK
$91,370
HOUSEHOLDER INCOME AGES 25 - 44 YEARS
14.5/ 100
METRIC RATING
206th/ 347
METRIC RANK
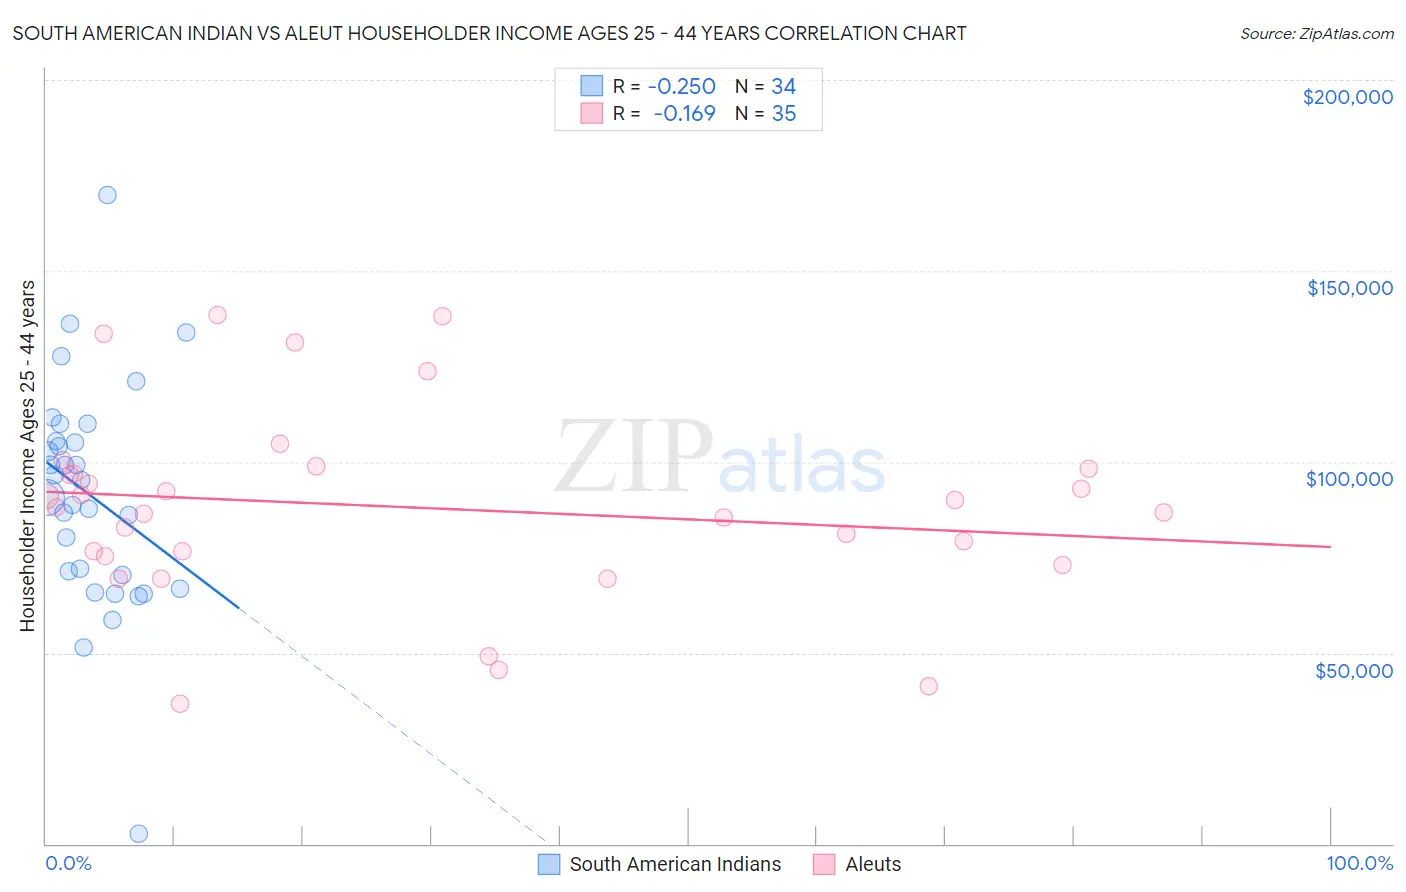
South American Indian vs Aleut Householder Income Ages 25 - 44 years Correlation Chart
The statistical analysis conducted on geographies consisting of 164,455,741 people shows a weak negative correlation between the proportion of South American Indians and household income with householder between the ages 25 and 44 in the United States with a correlation coefficient (R) of -0.250 and weighted average of $96,497. Similarly, the statistical analysis conducted on geographies consisting of 61,739,915 people shows a poor negative correlation between the proportion of Aleuts and household income with householder between the ages 25 and 44 in the United States with a correlation coefficient (R) of -0.169 and weighted average of $91,370, a difference of 5.6%.
Householder Income Ages 25 - 44 years Correlation Summary
| Measurement | South American Indian | Aleut |
| Minimum | $2,499 | $36,667 |
| Maximum | $170,036 | $138,313 |
| Range | $167,537 | $101,646 |
| Mean | $91,221 | $88,134 |
| Median | $92,899 | $88,006 |
| Interquartile 25% (IQ1) | $70,385 | $75,410 |
| Interquartile 75% (IQ3) | $105,466 | $98,125 |
| Interquartile Range (IQR) | $35,081 | $22,715 |
| Standard Deviation (Sample) | $29,879 | $24,944 |
| Standard Deviation (Population) | $29,437 | $24,585 |
Similar Demographics by Householder Income Ages 25 - 44 years
Demographics Similar to South American Indians by Householder Income Ages 25 - 44 years
In terms of householder income ages 25 - 44 years, the demographic groups most similar to South American Indians are Czech ($96,525, a difference of 0.030%), Slovene ($96,439, a difference of 0.060%), Slavic ($96,377, a difference of 0.12%), Ugandan ($96,667, a difference of 0.18%), and Basque ($96,709, a difference of 0.22%).
| Demographics | Rating | Rank | Householder Income Ages 25 - 44 years |
| Norwegians | 78.2 /100 | #145 | Good $96,866 |
| Ethiopians | 77.8 /100 | #146 | Good $96,824 |
| Immigrants | Syria | 77.4 /100 | #147 | Good $96,789 |
| Irish | 76.9 /100 | #148 | Good $96,730 |
| Basques | 76.6 /100 | #149 | Good $96,709 |
| Ugandans | 76.2 /100 | #150 | Good $96,667 |
| Czechs | 74.8 /100 | #151 | Good $96,525 |
| South American Indians | 74.5 /100 | #152 | Good $96,497 |
| Slovenes | 73.9 /100 | #153 | Good $96,439 |
| Slavs | 73.2 /100 | #154 | Good $96,377 |
| Moroccans | 70.3 /100 | #155 | Good $96,117 |
| Immigrants | Germany | 67.9 /100 | #156 | Good $95,913 |
| Immigrants | Uganda | 65.2 /100 | #157 | Good $95,698 |
| Scandinavians | 63.9 /100 | #158 | Good $95,596 |
| Costa Ricans | 63.5 /100 | #159 | Good $95,565 |
Demographics Similar to Aleuts by Householder Income Ages 25 - 44 years
In terms of householder income ages 25 - 44 years, the demographic groups most similar to Aleuts are Yugoslavian ($91,368, a difference of 0.0%), Immigrants from Thailand ($91,337, a difference of 0.040%), Immigrants from Eastern Africa ($91,458, a difference of 0.10%), Nepalese ($91,498, a difference of 0.14%), and Immigrants from Cambodia ($91,533, a difference of 0.18%).
| Demographics | Rating | Rank | Householder Income Ages 25 - 44 years |
| Kenyans | 16.8 /100 | #199 | Poor $91,684 |
| Whites/Caucasians | 16.7 /100 | #200 | Poor $91,668 |
| Japanese | 16.4 /100 | #201 | Poor $91,624 |
| Ecuadorians | 16.0 /100 | #202 | Poor $91,574 |
| Immigrants | Cambodia | 15.7 /100 | #203 | Poor $91,533 |
| Nepalese | 15.4 /100 | #204 | Poor $91,498 |
| Immigrants | Eastern Africa | 15.2 /100 | #205 | Poor $91,458 |
| Aleuts | 14.5 /100 | #206 | Poor $91,370 |
| Yugoslavians | 14.5 /100 | #207 | Poor $91,368 |
| Immigrants | Thailand | 14.3 /100 | #208 | Poor $91,337 |
| Immigrants | Uruguay | 13.2 /100 | #209 | Poor $91,171 |
| Immigrants | Kenya | 10.9 /100 | #210 | Poor $90,767 |
| Iraqis | 10.8 /100 | #211 | Poor $90,764 |
| Hawaiians | 10.6 /100 | #212 | Poor $90,722 |
| Immigrants | Bangladesh | 9.3 /100 | #213 | Tragic $90,448 |