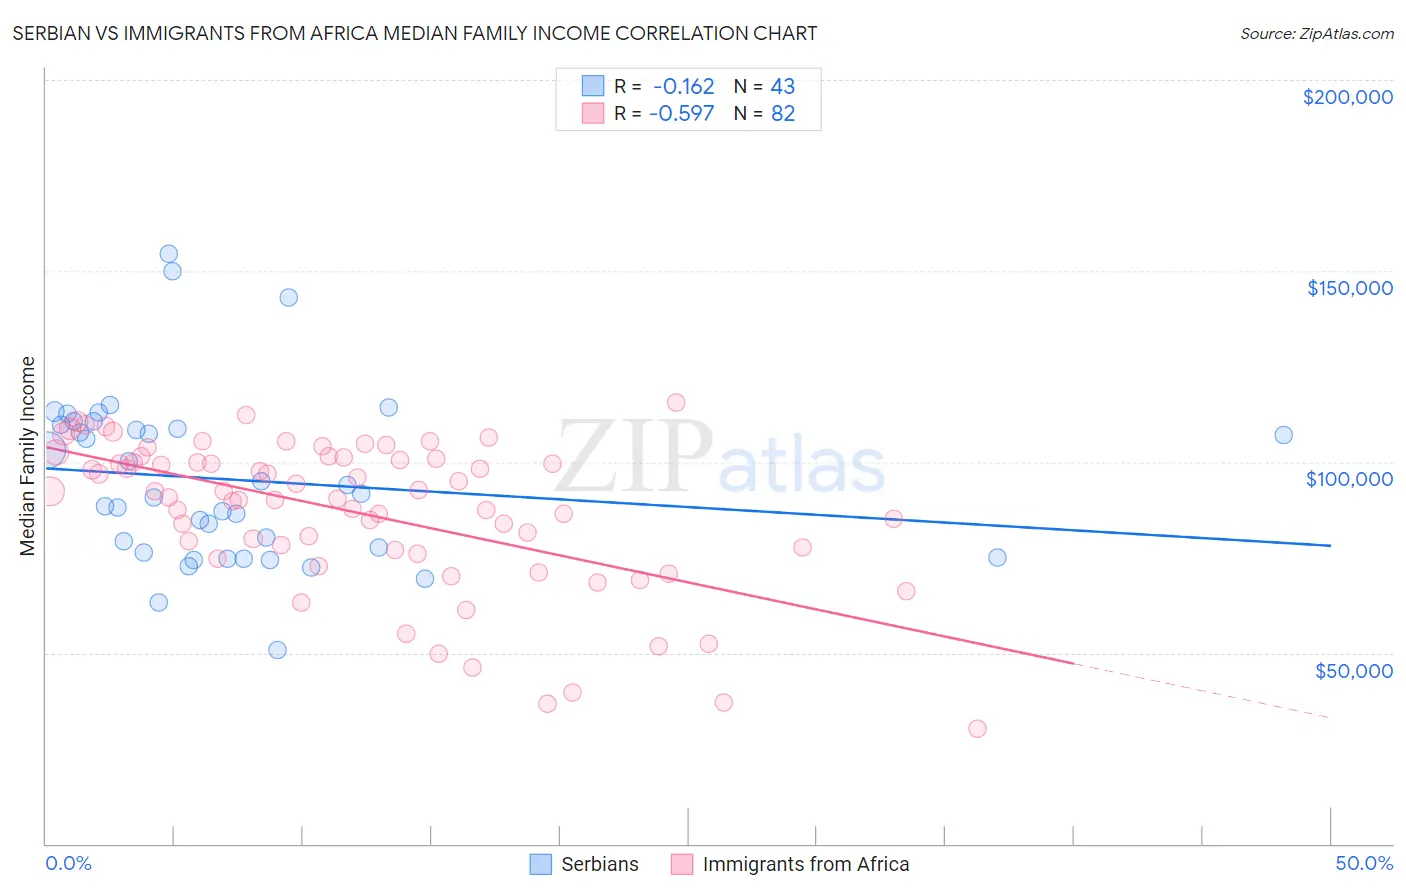
Serbian vs Immigrants from Africa Median Family Income
COMPARE
Serbian
Immigrants from Africa
Median Family Income
Median Family Income Comparison
Serbians
Immigrants from Africa
$107,157
MEDIAN FAMILY INCOME
90.8/ 100
METRIC RATING
126th/ 347
METRIC RANK
$100,256
MEDIAN FAMILY INCOME
22.5/ 100
METRIC RATING
198th/ 347
METRIC RANK
Serbian vs Immigrants from Africa Median Family Income Correlation Chart
The statistical analysis conducted on geographies consisting of 267,482,647 people shows a poor negative correlation between the proportion of Serbians and median family income in the United States with a correlation coefficient (R) of -0.162 and weighted average of $107,157. Similarly, the statistical analysis conducted on geographies consisting of 468,709,431 people shows a substantial negative correlation between the proportion of Immigrants from Africa and median family income in the United States with a correlation coefficient (R) of -0.597 and weighted average of $100,256, a difference of 6.9%.
Median Family Income Correlation Summary
| Measurement | Serbian | Immigrants from Africa |
| Minimum | $50,679 | $29,978 |
| Maximum | $154,464 | $115,502 |
| Range | $103,785 | $85,524 |
| Mean | $95,313 | $86,633 |
| Median | $91,648 | $91,514 |
| Interquartile 25% (IQ1) | $76,245 | $76,824 |
| Interquartile 75% (IQ3) | $109,780 | $100,972 |
| Interquartile Range (IQR) | $33,535 | $24,148 |
| Standard Deviation (Sample) | $22,166 | $19,648 |
| Standard Deviation (Population) | $21,907 | $19,528 |
Similar Demographics by Median Family Income
Demographics Similar to Serbians by Median Family Income
In terms of median family income, the demographic groups most similar to Serbians are Lebanese ($107,086, a difference of 0.070%), Taiwanese ($107,295, a difference of 0.13%), Immigrants from Ethiopia ($106,969, a difference of 0.18%), Arab ($106,952, a difference of 0.19%), and Brazilian ($106,942, a difference of 0.20%).
| Demographics | Rating | Rank | Median Family Income |
| Sri Lankans | 94.5 /100 | #119 | Exceptional $108,234 |
| Immigrants | Northern Africa | 94.3 /100 | #120 | Exceptional $108,161 |
| Europeans | 94.1 /100 | #121 | Exceptional $108,099 |
| Immigrants | Jordan | 92.9 /100 | #122 | Exceptional $107,715 |
| Carpatho Rusyns | 92.2 /100 | #123 | Exceptional $107,502 |
| Pakistanis | 91.7 /100 | #124 | Exceptional $107,390 |
| Taiwanese | 91.4 /100 | #125 | Exceptional $107,295 |
| Serbians | 90.8 /100 | #126 | Exceptional $107,157 |
| Lebanese | 90.5 /100 | #127 | Exceptional $107,086 |
| Immigrants | Ethiopia | 90.0 /100 | #128 | Excellent $106,969 |
| Arabs | 89.9 /100 | #129 | Excellent $106,952 |
| Brazilians | 89.8 /100 | #130 | Excellent $106,942 |
| Canadians | 88.1 /100 | #131 | Excellent $106,597 |
| Immigrants | Fiji | 87.8 /100 | #132 | Excellent $106,544 |
| Ugandans | 87.8 /100 | #133 | Excellent $106,541 |
Demographics Similar to Immigrants from Africa by Median Family Income
In terms of median family income, the demographic groups most similar to Immigrants from Africa are Immigrants from Cameroon ($100,289, a difference of 0.030%), Samoan ($100,344, a difference of 0.090%), Yugoslavian ($100,119, a difference of 0.14%), Immigrants from South America ($100,414, a difference of 0.16%), and Spanish ($99,977, a difference of 0.28%).
| Demographics | Rating | Rank | Median Family Income |
| Colombians | 27.2 /100 | #191 | Fair $100,750 |
| Immigrants | Kenya | 26.5 /100 | #192 | Fair $100,679 |
| Iraqis | 26.3 /100 | #193 | Fair $100,658 |
| Uruguayans | 26.3 /100 | #194 | Fair $100,656 |
| Immigrants | South America | 23.9 /100 | #195 | Fair $100,414 |
| Samoans | 23.3 /100 | #196 | Fair $100,344 |
| Immigrants | Cameroon | 22.8 /100 | #197 | Fair $100,289 |
| Immigrants | Africa | 22.5 /100 | #198 | Fair $100,256 |
| Yugoslavians | 21.3 /100 | #199 | Fair $100,119 |
| Spanish | 20.1 /100 | #200 | Fair $99,977 |
| Immigrants | Thailand | 19.0 /100 | #201 | Poor $99,840 |
| Whites/Caucasians | 18.7 /100 | #202 | Poor $99,800 |
| Scotch-Irish | 17.1 /100 | #203 | Poor $99,591 |
| Ghanaians | 12.6 /100 | #204 | Poor $98,877 |
| Hawaiians | 12.5 /100 | #205 | Poor $98,869 |